Figure 3.

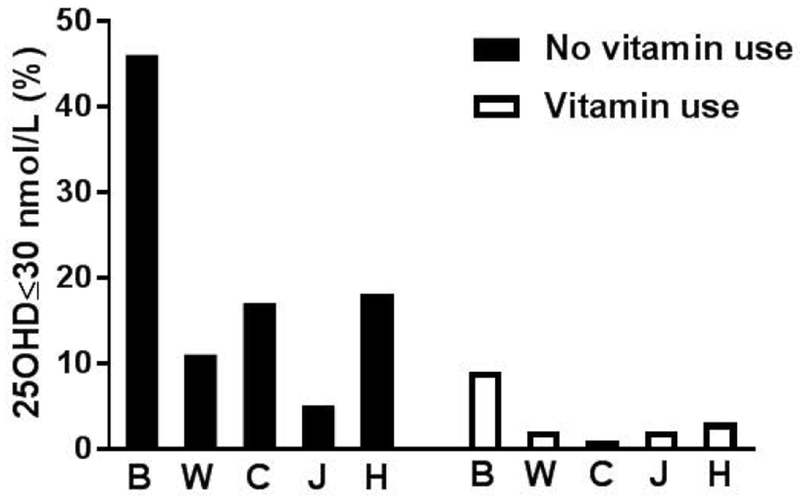
Bar chart showing the proportion of subjects meeting criteria for low serum 25-hydroxyvitamin D defined as ≤30 nmol/L when stratified by race/ethnicity and vitamin use. B, Black; W, White, C, Chinese; J, Japanese; H, Hispanic

Bar chart showing the proportion of subjects meeting criteria for low serum 25-hydroxyvitamin D defined as ≤30 nmol/L when stratified by race/ethnicity and vitamin use. B, Black; W, White, C, Chinese; J, Japanese; H, Hispanic