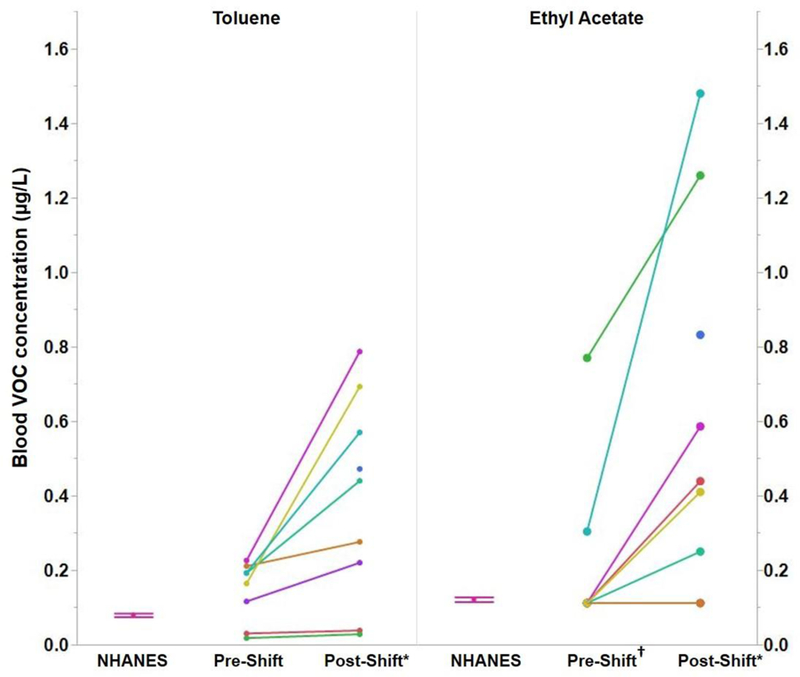
Figure 1.

Toluene and ethyl acetate blood levels measured before and after the work shift (2016–2017) and compared to the U.S. general population (NHANES 2013–2014 for female nonsmokers). *Post- shift blood levels significantly higher from pre-shift or NHANES. †All NHANES ethyl acetate and all but two pre-shift ethyl acetate samples were <MDL. Each color in the figure corresponds to the same participant.
