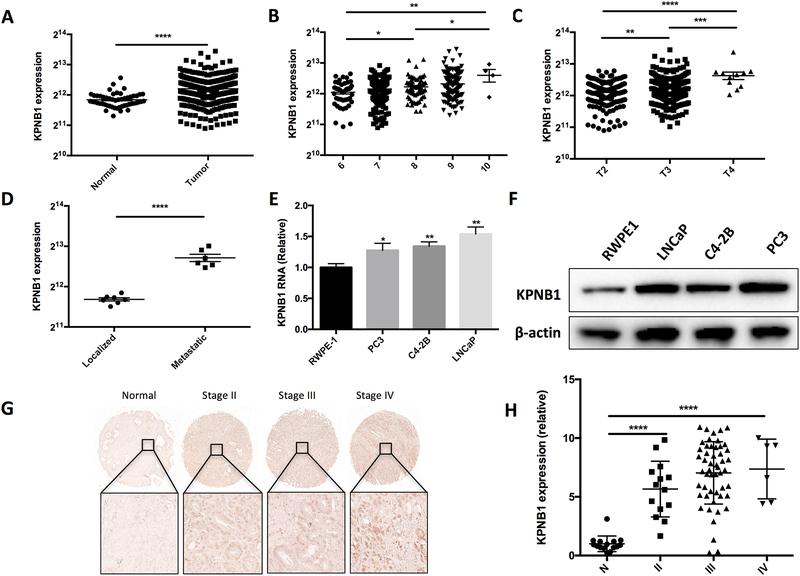
Figure 1. KPNB1 expression is associated with human prostate cancer progression.
A) The expression level of KPNB1 in human prostate cancer samples (N=498) and normal prostate tissues (N=52). Samples are from TCGA dataset. B) The expression level of KPNB1 human prostate cancer samples with different Gleason scores. Samples are from TCGA dataset. C) The expression level of KPNB1 human prostate cancer samples with different pathological stages. Samples are from TCGA dataset. D) The expression level of KPNB1 of localized and metastasis human prostate cancer samples. Samples are from GEO dataset. E) qPCR results showing relative expression level of KPNB1 RNA in indicated cell lines. FTH1 was used as internal control. F) Immunoblotting results showing protein level of KPNB1 in indicated cell lines. β-actin was used as internal control. G) Representative images of IHC staining of KPNB1 on human prostate cancer TMA slides. H) Statistical results of KPNB1 positive cells on the TMA slides. *p <0.05, **p<0.01, *** p<0.001, ****p<0.0001.

