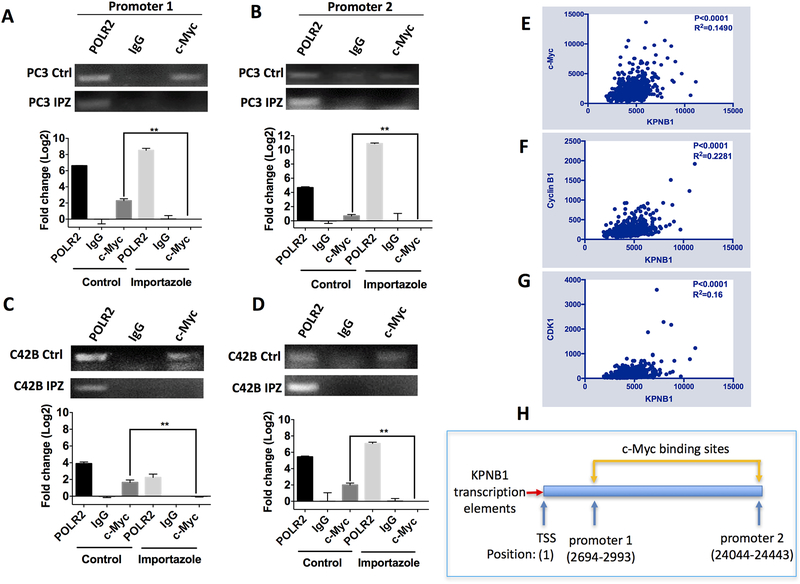
Figure 3. c-Myc binds to the promoter regions of KPNB1.
A-D) qPCR showing the interaction of c-Myc with promoter regions of KPNB1. The indicated PCa cell lines were treated with importazole (20 μM) for 24 hours, DMSO was used as vehicle control. DNA of the treated cells were precipitated and purified by c-Myc antibody for CHIP assay. Polymerase II (POLR 2) antibody and control IgG antibody were used as positive and negative control, respectively. Relative amount of precipitated promoter DNA was analyzed using qPCR, and the PCR product was revealed by running an agarose gel. E-G) Analysis of the TCGA dataset to show the correlation of KPNB1 with c-Myc, Cyclin B1 and CDK1 in human prostate cancer samples. Correlations between indicated genes were analyzed by computing Pearson correlation coefficients. P value and R squared were revealed as well. H) Schematic model indicating the promoter region (c-Myc binding sites) of KPNB1. **p<0.01.

