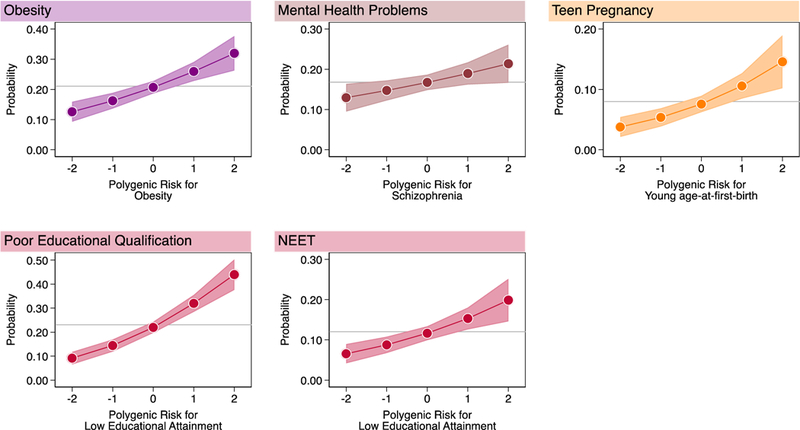
Figure 1. Children with higher genetic risk had more health and social problems by age 18 years.

Graphs show fitted probabilities of each health and social problem across the distribution of polygenic risk. Models were adjusted for sex. Gray lines intersecting the Y-axis show the frequency of the health or social problem in E-Risk. Shaded areas around the fitted slopes show 95% Confidence intervals. Probability of obesity is graphed against polygenic risk for obesity (RR=1.26 [1.14–1.38], n=1,837); probability of mental-health problems is graphed against polygenic risk for schizophrenia (RR=1.13 [1.02–1.26], n=1,863); probability of teen pregnancy is graphed against polygenic risk for young age-at-first-birth 1.40 [1.19–1.64], n=1,825); probabilities of poor educational qualification and NEET (Not in Education, Employment, or Training) status are graphed against polygenic risk for low educational attainment (poor educational qualification RR=1.47 [1.34–1.60], n=1,860; NEET RR 1.32 [1.15–1.52], n=1,863) (Supplementary Table 1). Effect-sizes are reported for a 1-SD increase in polygenic risk.
