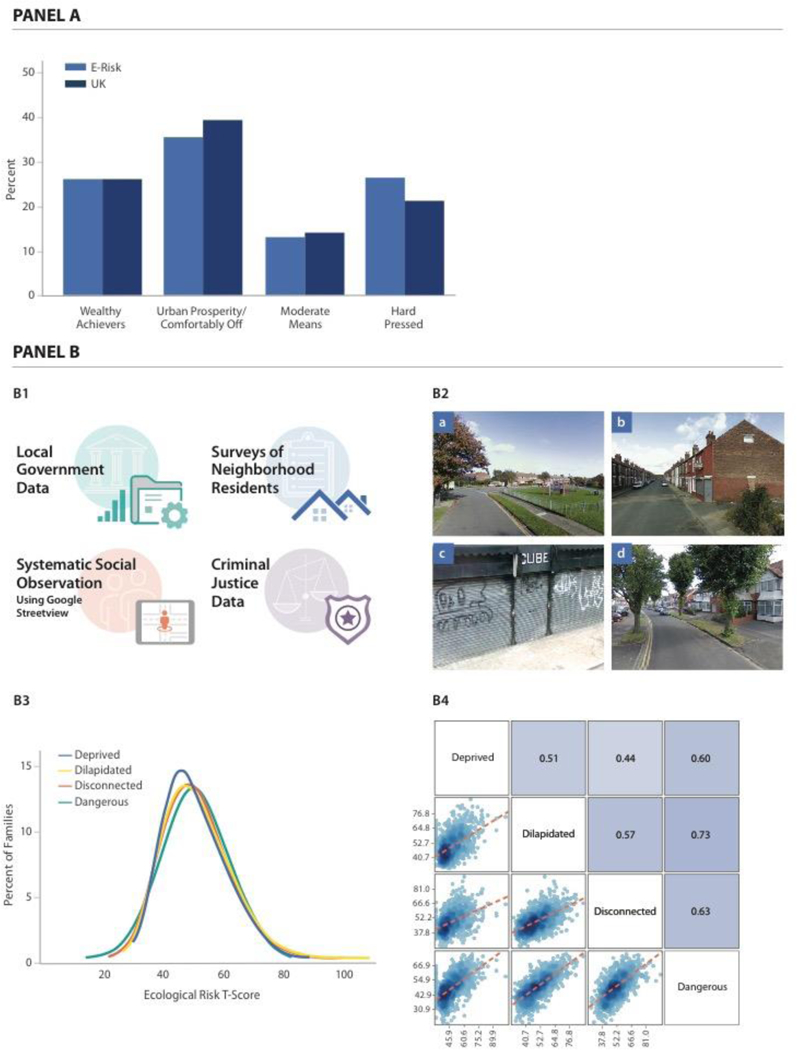
Figure 2. Quantification of E-Risk families’ neighborhood disadvantage using ACORN and a composite Ecological-Risk Index.

Panel A of the Figure shows distributions of ACORN (“A Classification of Residential Neighborhoods”) classifications for E-Risk families at the time of the age-12 interview (n=1,008 families with genetic data, light blue bars) and the corresponding distribution for the United Kingdom obtained from http://doc.ukdataservice.ac.uk/doc/6069/mrdoc/pdf/6069 acorn userguide.pdf (dark blue bars). Panel B of the Figure contains 4 cells. Cell B1 depicts the four sources of data used for ecological-risk assessment: from top to bottom, these are geodemographic data from local governments, official crime data, Google Street View Systematic Social Observation (SSO), and resident surveys. Image created by Motsavage Design. Cell B2 shows images illustrating (a) Well-kept neighborhood; visible play area for children; roads and sidewalks in good condition. (b) Evidence of graffiti; poorly kept sidewalk and trash container; sidewalks in fair condition. (c) Deprived residential area; vacant lot in poor condition; heavy amount of litter; sidewalks and road in poor condition. (d) Comfortably-off residential area; roads and sidewalks in good conditions; no signs of litter, graffiti or other signs of disorder. Images: Google Street View. Cell B3 shows distributions of four ecological-risk measures derived from these data: economic deprivation, physical dilapidation, social disconnectedness, and danger. Values of the ecological-risk measures are expressed as T scores (M=50, SD=10) (n=987 families with genetic data). Cell B4 shows a matrix of the ecological-risk measures illustrating their correlation with one another (see Supplementary Table 2). Matrix cells below and to the left of measures show scatterplots of their association. Matrix cells above and to the right of measures show their correlation expressed as Pearson’s r (n=973 families with genetic data and data on all four ecological risk measures).
