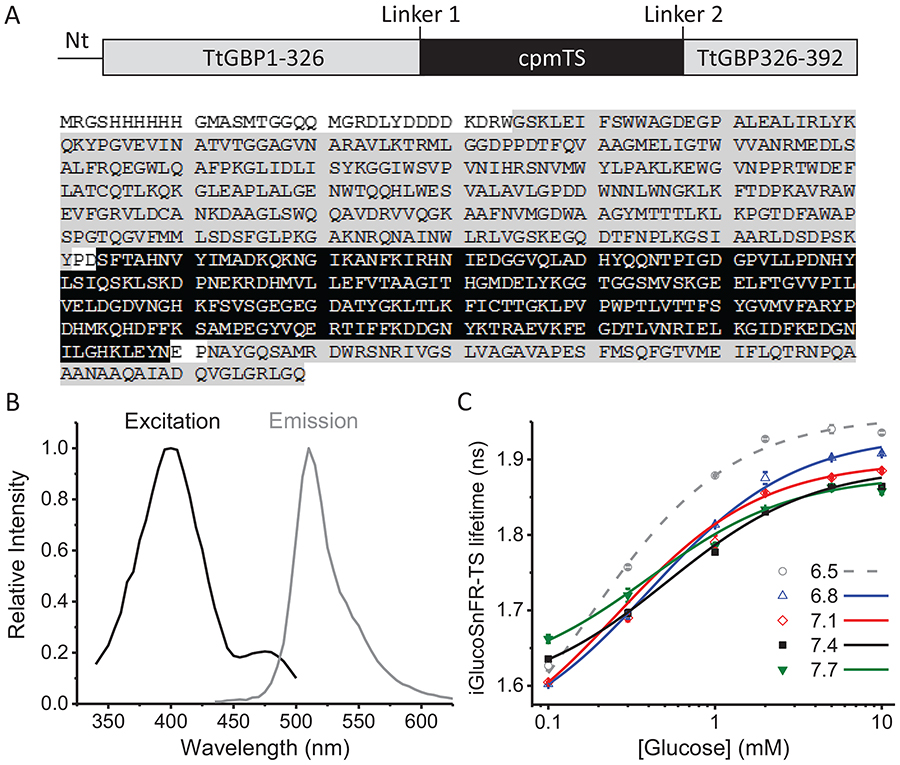
Figure 1. Sensor design and characterization.
(A) Top, schematic representation of the glucose sensor. Abbreviations indicate the N-terminal pRSET affinity tag sequence (Nt), the glucose-binding protein (TtGBP) and the circularly-permuted T-Sapphire (cpmTS). Bottom, the full sequence of the sensor as reported in Díaz-García et al. (2017), highlighting each domain with the same color code from the schematic representation. (B) Excitation and emission spectra of the purified sensor protein. (C) Dose-response curves at different pH values. Data points and whiskers represent the mean and the range of duplicate measurements, respectively. The curves represent the best fit to a Hill equation (see Eq. 1 in Methods). Experiments were performed at room temperature of approximately 22°C.

