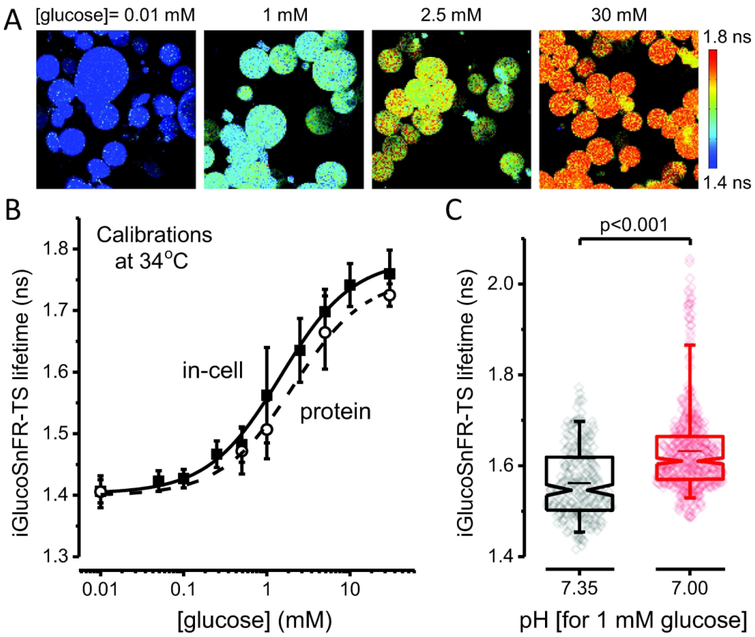
Figure 2. Calibration of the lifetime sensor iGlucoSnFR-TS.
(A) Representative images of IAA-treated, permeabilized HEK293T cells visualized by 2p-FLIM. The cells were incubated at different glucose concentrations after permeabilizing with β-escin. Cells exposed to higher glucose concentrations in the bath perfusion exhibited higher fluorescence lifetimes of the sensor. Note that permeabilization with β-escin caused HEK293T cells to adopt a round shape. (B) Dose-response curve obtained in permeabilized HEK293T cells, at 34°C. Points represent the mean ± SD of 133 – 258 cells from three independent experiments (N = 3, each for a particular passage/transfection). The solid line corresponds to the curve obtained using averaged parameters from three different experiments (see Table 1). The dashed line represents the in vitro calibration of the purified sensor, performed under similar conditions. Points represent the mean ± SD of three independent experiments (N = 3, each for a particular protein preparation). (C) Low pH increases the lifetime of the sensor in permeabilized cells at 34°C. The cells were bathed with a solution containing 1 mM glucose, with the pH adjusted to 7.35 (Ncells = 238, imaged in different fields from three coverslips, each from a different passage/transfection) or 7.00 (Ncells = 471, imaged in different fields from three different coverslips, from the same passage/transfection). Box plots indicate the median and middle half of the data, with whiskers spanning the 5 – 95 percentiles of the population. The notch represents the 95% confidence interval around the median, and the horizontal line indicates the mean. The raw data is overlapped to the box plots. Significance levels were obtained using an unpaired non-parametric Mann-Whitney test.

