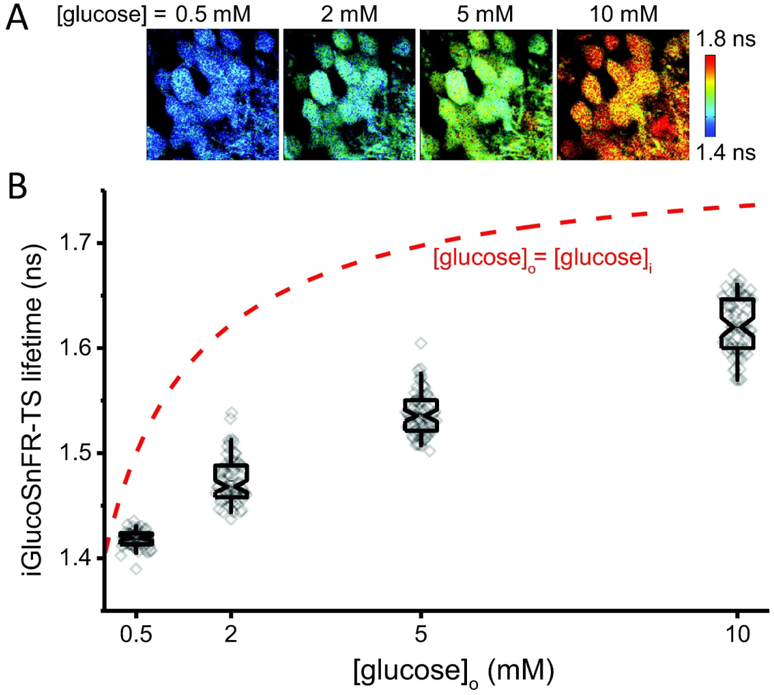
Figure 4. Neuronal glucose concentrations in mouse brain slices.
(A) Representative images of dentate granule neurons located 50 μm deep into a hippocampal slice, exposed to different glucose concentrations in ACSF. (B) Box plots indicate the median and middle half of the data, with whiskers spanning the 5 – 95 percentiles of the population. The notch represents the 95% confidence interval around the median, and the horizontal line indicates the mean. The raw data is overlapped to the box plots (Nneurons = 51, Nslices = 4 and Nmice = 2 for [glucose]o = 0.5 mM; Nneurons = 69, Nslices = 6 and Nmice = 3 for 2, 5 and 10 mM glucose in the ACSF). Experiments were performed at 34°C. The red dashed line represents the expected sensor lifetime when the intracellular glucose concentration is equilibrated with the nominal glucose concentration in the bath (predicted from the in-cell calibration in Figure 2).

