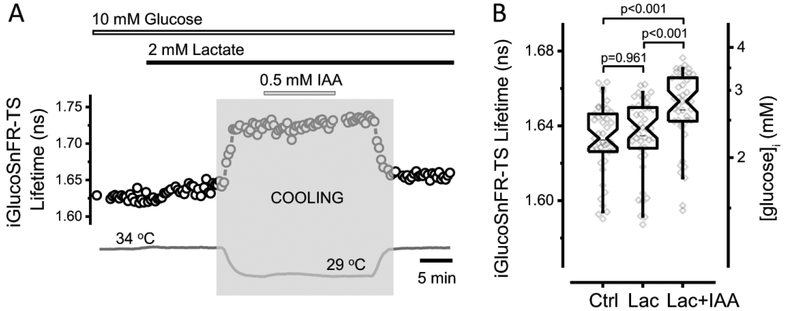
Figure 5. Glycolytic inhibition increases neuronal glucose concentrations in acute mouse brain slices.
(A) Representative trace of iGlucoSnFR-TS lifetime in an experiment designed to assess intracellular glucose concentration in a dentate granule neuron upon glycolysis inhibition. The bars indicate the times of application of fuels (10 mM glucose and 2 mM lactate), as well as IAA (0.5 mM), which inhibits glycolysis irreversibly. The temperature was lowered (shaded zone) to minimize cell damage during IAA application (The change in the fluorescence lifetime after cooling and heating reflects the temperature sensitivity of the sensor, see Figure 6). To minimize the effects of dysregulated synaptic activity, a cocktail of synaptic blockers was used: 5 μM NBQX, 25 μM D-AP5 and 100 μM Picrotoxin to inhibit AMPA, NMDA and GABAA ionotropic receptors, respectively. (B) Addition of lactate (Lac) to the ACSF did not affect the [glucose]i, but subsequent glycolytic inhibition with IAA (Lac+IAA) increased the fluorescence lifetime of the sensor, indicating an elevation in [glucose]i. Box plots indicate the median and middle half of the data, with whiskers spanning the 5 – 95 percentiles of the population. The notch represents the 95% confidence interval around the median, and the horizontal line indicates the mean. The raw data is overlapped to the box plots (Nneurons = 41, Nslices = 5 and Nmice = 3). Significance levels were obtained using a paired non-parametric Friedman test with a Dunn’s post hoc test for multiple comparisons. One outlier data point was omitted because it was >5 SD below the mean.

