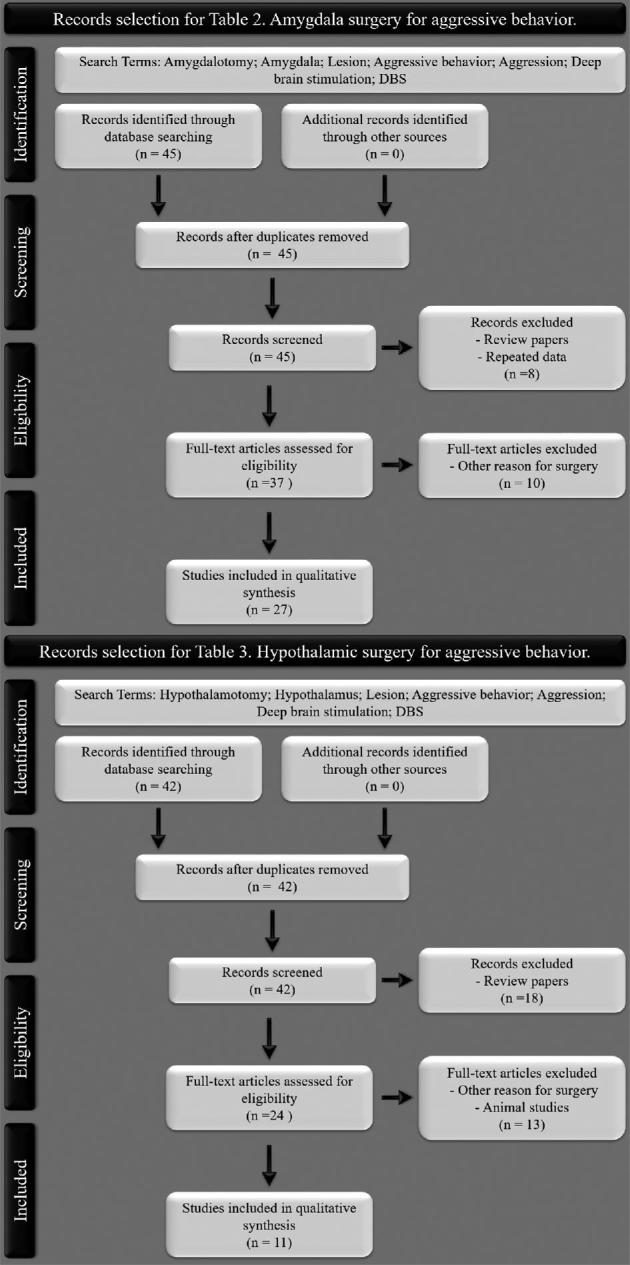
. 2019 Jan 23;85(1):11–30. doi: 10.1093/neuros/nyy635
© Congress of Neurological Surgeons 2019
This is an Open Access article distributed under the terms of the Creative Commons Attribution-NonCommercial-NoDerivs licence (http://creativecommons.org/licenses/by-nc-nd/4.0/), which permits non-commercial reproduction and distribution of the work, in any medium, provided the original work is not altered or transformed in any way, and that the work is properly cited. For commercial re-use, please contact journals.permissions@oup.com

