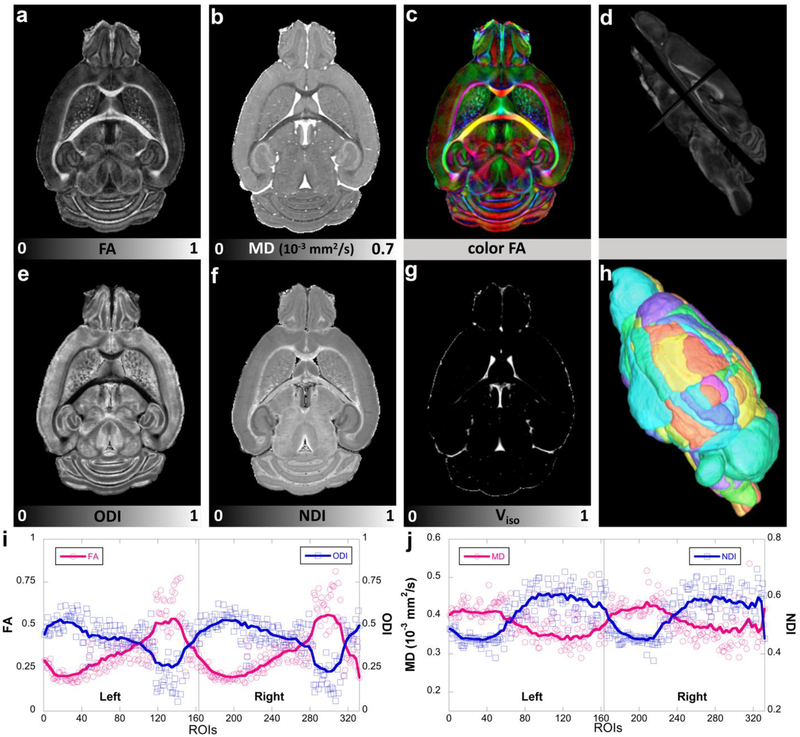
Figure 3:
DTI metrics (FA, MD, color FA), NODDI metrics (ODI, NDI, Viso) and the corresponding quantitative values at different ROIs. The whole brain is divided to 332 regions (166 in each hemisphere, h) based on a previous parcellation of the mouse brain atlas. Figure 3d shows the FA images in different views. FA and ODI images show opposite contrast, where higher FA regions exhibits lower ODI values (i). The same inverse contrast is also found between MD and NDI images (j). Left: left hemisphere; Right: right hemisphere.

