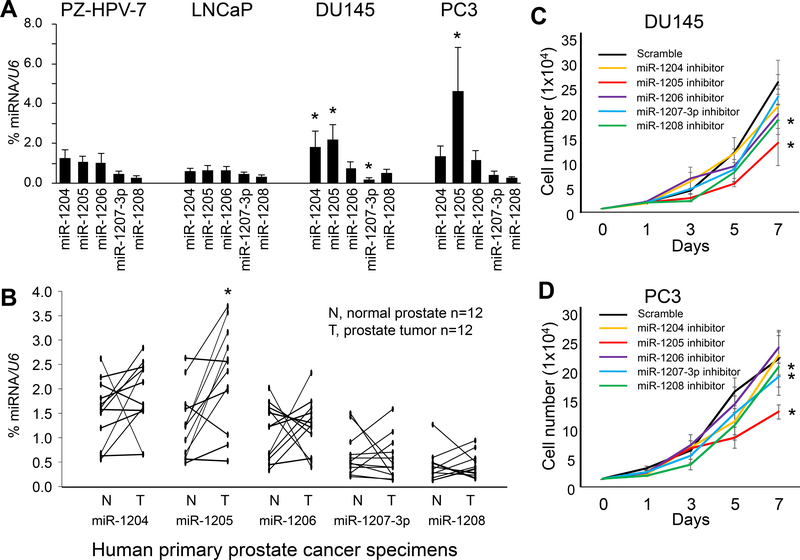
Figure 2. Expression levels of miRs-1204~1208 and their effect on cell proliferation in human prostate cancer cells.
(a) Quantification of expression of miRs-1204~1208 by qPCR as a percentage of U6 expression in PZ-HPV-7, LNCaP, DU145, and PC3 cells. Data are presented as means ± SD. * p < 0.05 by two-tailed t-test for each miRNA in PC3, DU145 or LNCaP vs. PZ-HPV-7 cells. (b) Quantification of miRs-1204~1208 expression by qPCR as a percentage of U6 expression in primary castration-resistant prostate cancer specimens. * p < 0.05 by Wilcoxon signed-rank test of T group vs. N group. T, micro-dissected prostate cancer cells; N, micro-dissected normal prostate epithelial cells. (c, d) Proliferation of DU145 and PC3 cells after transfection with an miR-1204~1208 inhibitor for 7 days. Data are presented as means ± SD. * p < 0.05 by two-way ANOVA test vs. scramble group. All experiments were repeated three times.

