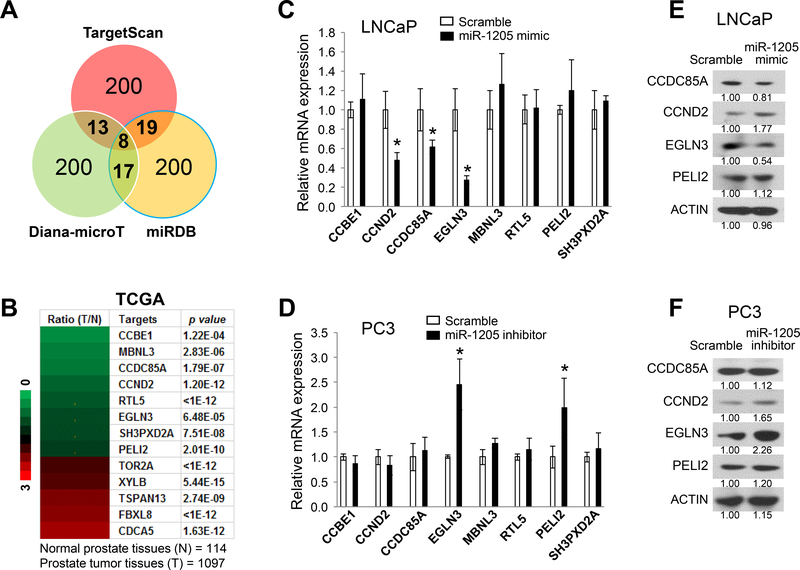
Figure 4. Identification of miR-1205 target genes in human prostate cancer cells.
(a) Prediction of miR-1205 target genes by multiple algorithms using three miRNA databases: TargetScan (www.targetscan.org), Diana-microT (diana.imis.athena-innovation.gr), and miRDB (mirdb.org). A total of 57 candidates of miR-1205 target genes were identified in at least two databases. (b) Heat map of mRNA expression levels of the predicted miR-1205 target genes in prostate cancer tissues (T) compared with that in normal prostate tissues (N) from the TCGA dataset. A total of 13 predicted target genes were changed (>1.5-fold change, p < 0.001, T vs. N), including 8 downregulated genes (green color) and 5 upregulated genes (red color). (c) Relative expression levels of downregulated candidate genes were determined by qPCR in LNCaP cells after treatment with a scrambled control or an miR-1205 mimic. Data are presented as means ± SD. * p < 0.05 by two-tailed t-test for the miR-1205 mimic group vs. the scramble group. (d) Relative expression levels of downregulated candidate genes were determined by qPCR in LNCaP cells after treatment with a scrambled control or an miR-1205 inhibitor. Data are presented as means ± SD. * p < 0.05 by two-tailed t-test for the miR-1205 inhibitor group vs. the scramble group. (e) Protein expression in LNCaP cells measured by Western blotting at 48 hours after transfection with a scrambled control or an miR-1205 mimic. (f) Protein expression measured by Western blotting in PC3 cells at 48 hours after transfection with a scrambled control or an miR-1205 inhibitor. All experiments were repeated three times.

