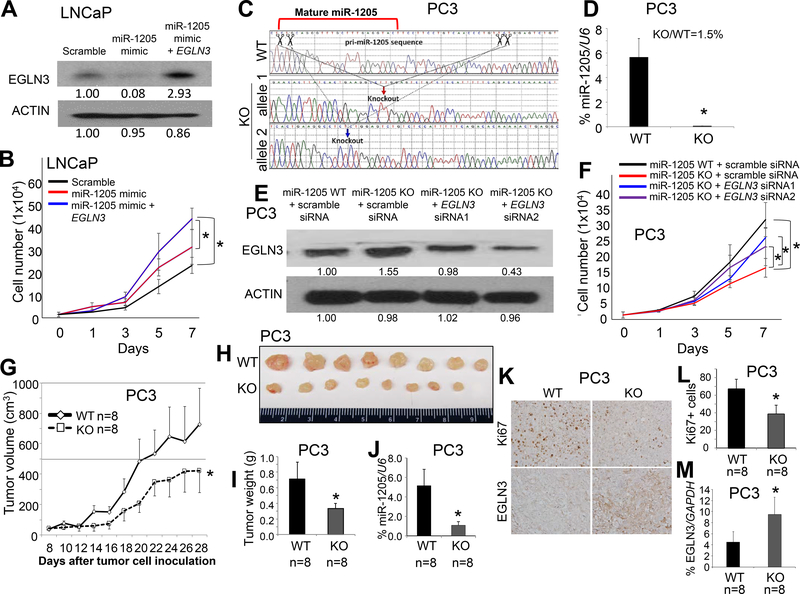
Figure 5. Effects of miR-1205 and its target gene EGLN3 on growth of human prostate cancer cells.
(a) Protein expression of EGLN3 was measured by Western blotting in LNCaP cells at 48 hours after transfection with a scrambled control, an miR-1205 mimic, or an miR-1205 mimic and the pcDNA6-EGLN3-coding sequence (without the 3’-UTR). (b) Proliferation of LNCaP cells after transfection for 7 days. Data are presented as means ± SD. * p < 0.05 by two-way ANOVA test between the two groups. (c) Sanger sequencing of CRISPR/Cas9 editing PC3 cells. Down-arrows indicate knockout sites. WT, wild-type; KO, knockout. (d) Quantification of miR-1205 expression by qPCR as a percentage of U6 expression in PC3 cells. Data are presented as means ± SD. * p < 0.05 by two-tailed t-test for the miR-1205 KO group vs. WT group. (e) Protein expression of EGLN3 was measured by Western blotting of miR-1205 WT or KO PC3 cells at 48 hours after transfection with a scrambled control or an miR-1205 inhibitor or both an miR-1205 inhibitor and EGLN3 siRNA. (f) Proliferation of PC3 cells after transfection for 7 days. Data are presented as means ± SD. * p < 0.05 by two-way ANOVA test between two groups. (g) Tumor growth in nude mice subcutaneously injected with miR-1205 WT or KO PC3 cells. Data are presented as means ± SD of the tumor volumes. * p < 0.05 by two-way ANOVA test between WT and KO groups. Representative images (h) and weights (i) of xenograft tumors at day 28 after injection. (j) Quantification of expression of miR-1205 by qPCR as a percentage of U6 expression in micro-dissected xenograft prostate cancer cells. (k) Representative immunohistochemical staining of Ki67 and EGLN3 in xenograft prostate tumor tissues. Top panels: Ki67 staining; bottom panels: EGLN3 staining. (l) The percentage of Ki67+ cells as an indicator of proliferating cells among the xenograft prostate tumor tissues. At least five 40x fields for each mouse were counted. (m) Quantification of mRNA expression of EGLN3 by qPCR as a percentage of GAPDH expression in micro-dissected xenograft prostate cancer cells. Data are presented as means ± SD. * p < 0.05 by two-tailed t-test between WT and KO groups. All experiments were repeated three times.

