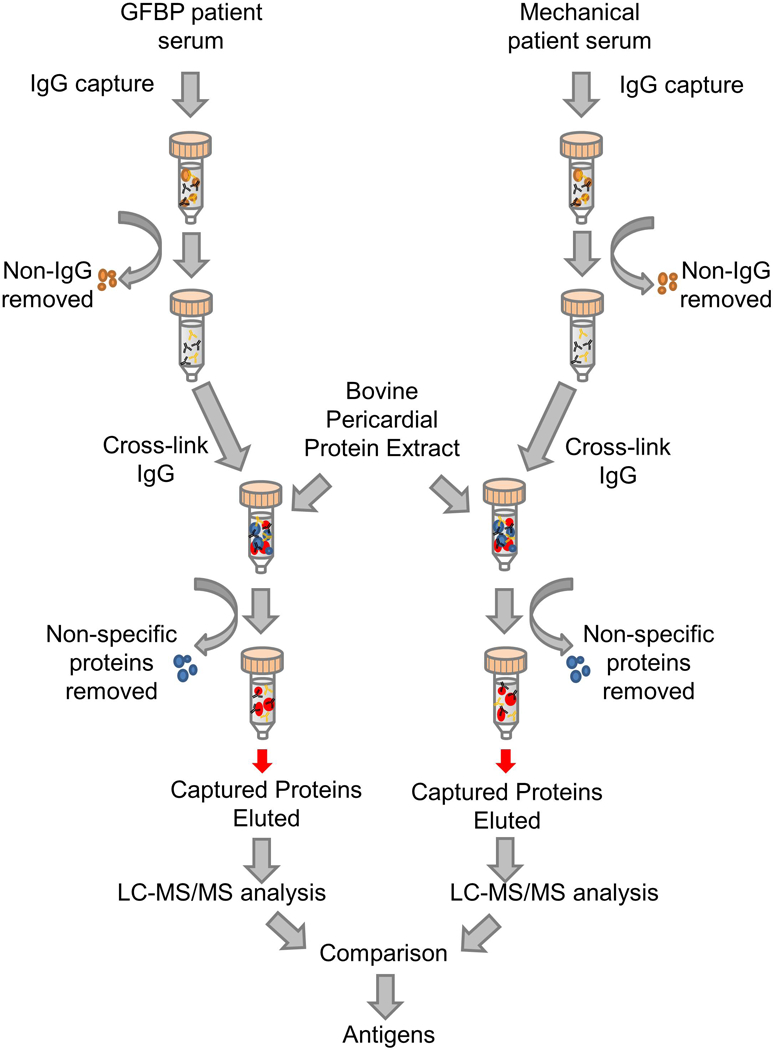
Figure 2. Flow Diagram of Affinity Chromatrography.

Columns were loaded with serum from patients who had received either a mechanical or GFBP valve. IgG antibodies were captured within the column and non-IgG serum components were washed off the column. The IgG antibodies were crosslinked to the column and then bovine pericardial protein extract was added. Non-specific proteins were washed off the column while captured proteins were eluted separately and submitted for LC-MS/MS analysis. Differences between the two groups were analyzed to determine which proteins were antigenic.
