
Figure 2.
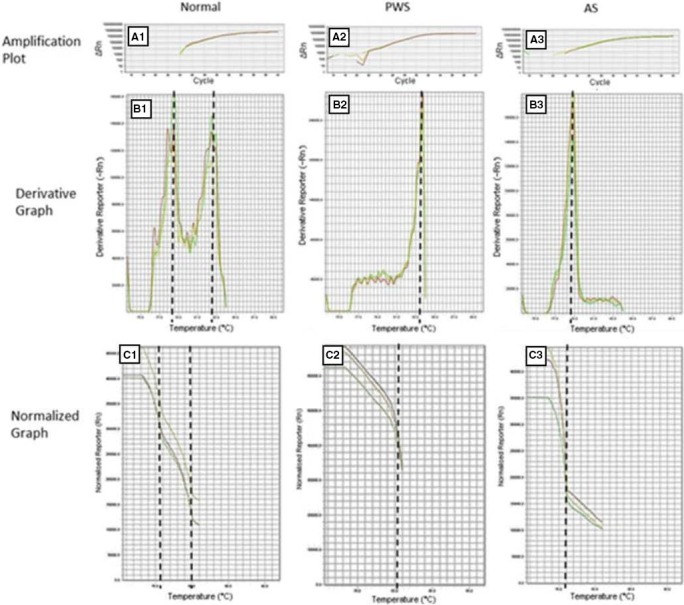
Methylation Pattern of three individuals analyzed by MS‐HRM with a unique pair of primers. Amplifications plot related to Normal (A1), PWS (A2), and AS (A3). Derivative Graphs show the melting peak to each allele. The normal patient in derivative graphs (B1) present two peaks corresponding to the paternal unmethylated and maternal methylated alleles. Normalized Graph displays the initial fluorescence issued when all products are double‐stranded and the maximum amount of dye is bound. Normal patients present to fluorescence drops corresponding to paternal and maternal allele (C1). As the temperature increases, the PCR products dissociate and the dye is released decreasing the fluorescent signal. The temperature differences between paternal and maternal allele are due to the CpG bound chemistry. Methylated cytosines are nonreactive to bisulfite conversion while nonmethylated cytosines turn uracil. Regions rich in CpG need a higher temperature to dissociate. The temperature of melting detected for maternal methylated allele was 83.3°C and 78.8°C for the paternal nonmethylated allele. The absence of paternal allele confirms a PWS (B2 and C2) while the absence of maternal allele confirms AS (B3 and C3)