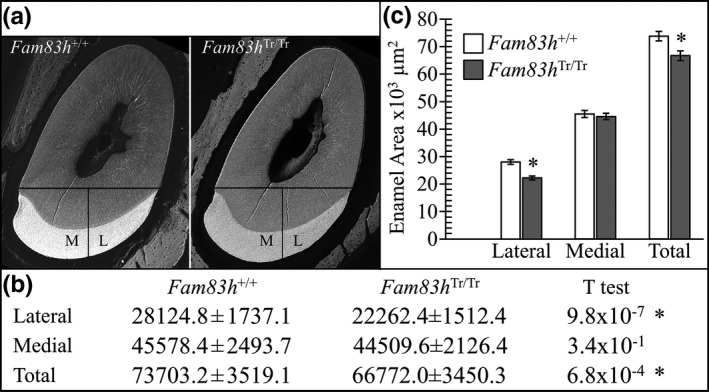
Figure 8.

Enamel area on 7‐week mandibular incisor level 8 (alveolar crest) cross sections. (a) bSEM images showing how the enamel was divided into mesial and lateral regions by drawing a line from the mesial cervical margin to the lateral cervical margin and drawing a line perpendicular from its midpoint. The mesial, lateral, and total cross‐sectional areas (mm2) were determined by outlining the enamel on Photoshop (Fam83h +/+ n = 8; Fam83h Tr/Tr n = 10; see Figure S24). (b) Table showing the average areas and ρ values (T test). All ρ values 0.01 or below were considered to be significant (*). (c) Plot of the average lateral, mesial, and total surface areas of Fam83h+/+ (n = 8) and Fam83h Tr/Tr (n = 10) mice. Significant differences were observed between the wild‐type and the Fam83h homozygous truncation (Fam83h Tr/Tr) incisors in their lateral and total cross‐sectional areas, but not in the mesial enamel
