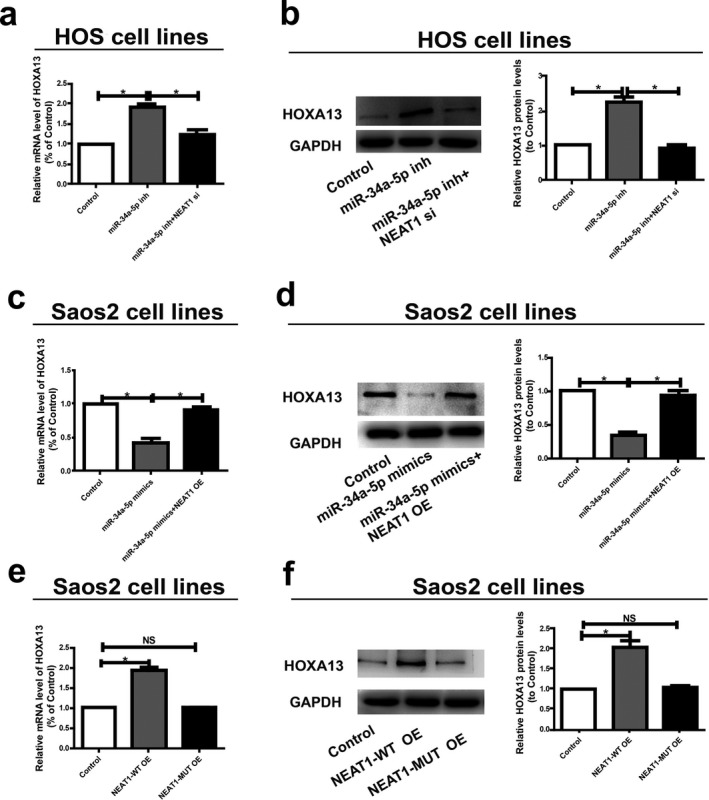
Figure 5.

NEAT1/miR‐34a‐5p axis is critical for the expression of HOXA13. (a) MiR‐34a‐5p inhibitor with or without NEAT1 siRNA is transfected into HOS cells and the mRNA level of HOXA13 is evaluated by qRT‐PCR. (b) Western blot analysis of HOXA13 protein level following treatment of HOS cells with miR‐34a‐5p inhibitor or NEAT1 siRNA. GAPDH is used as control. (c) Saos2 cells are transfected with miR‐34a‐5p with or without NEAT1 overexpress plasmid and qRT‐PCR is applied to detect the relative mRNA levels of HOXA13 compared with controls. (d) Relative protein level of HOXA13 when transfected with miR‐34a‐5p mimics and reversed by NEAT1 expression plasmid. (e) Relative mRNA level of HOXA13 when transfected with NEAT1‐WT overexpression plasmid or NEAT1‐MUT overexpression plasmid. (f) Relative protein level of HOXA13 when transfected with NEAT1‐WT overexpression plasmid or NEAT1‐MUT overexpression plasmid. Data are presented as mean ± SD. *p < 0.05, ns, no significantly difference
