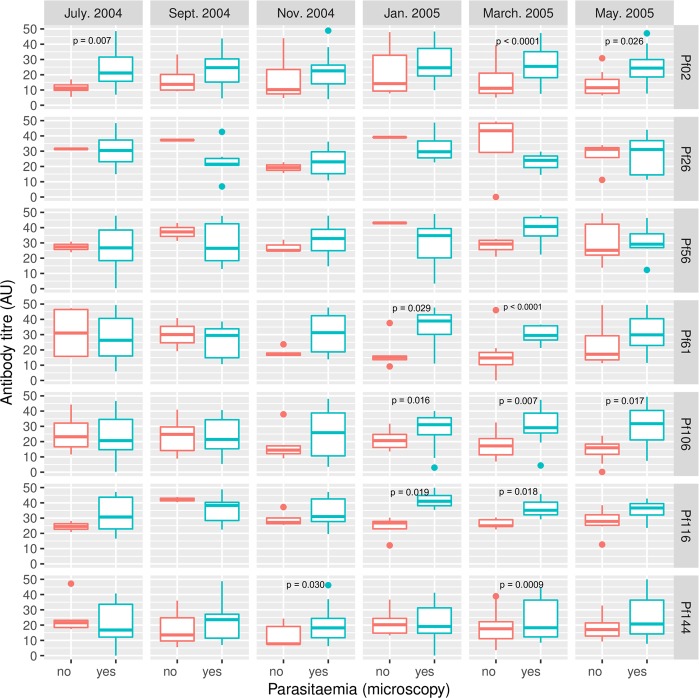
Figure 3.
Comparison of antigen-specific antibody levels between parasitemic and non-parasitemic children at the different sampling times. Parasitaemia was determined by microscopic examination of thick and thin blood smears. Boxes represent the median, 25th and 75th percentiles and whiskers represent 1.5 times the interquartile range. The median, 25th and 75th percentiles, and corresponding P values, have been provided in Supplementary Table 2.

