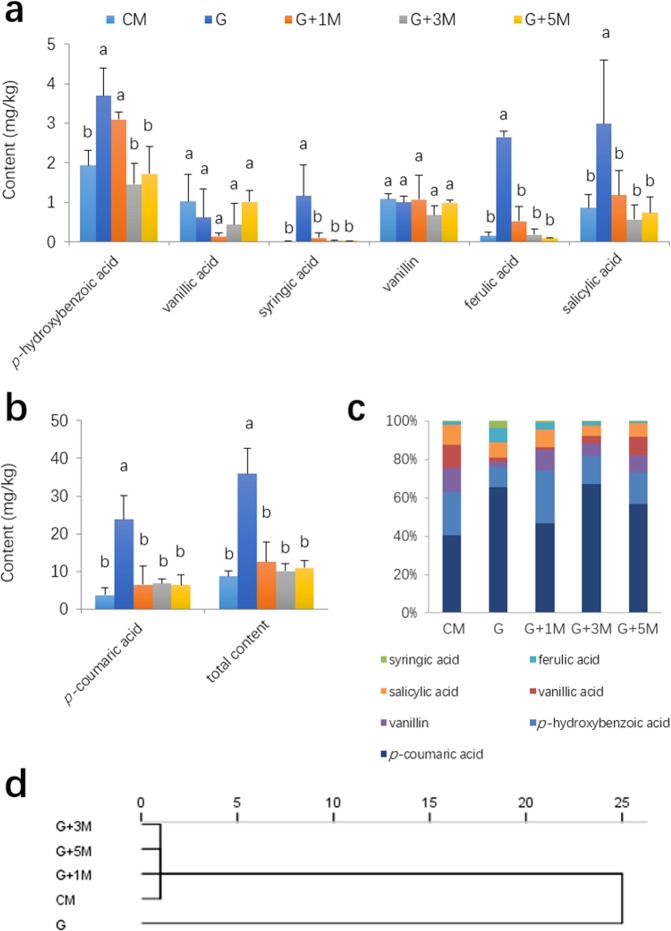
Figure 2.
Concentrations (Mean ± SD, n = 3) of the seven phenolic acids (a,b) and their ratios (c) in soil samples and dendrogram from hierarchical cluster analysis using the between-group linkage method and squared Euclidean distance (d). Error bars denote the standard deviation of the mean (n = 3), and data designated with the same letter are not significantly (P < 0.05) different, according to Fisher’s least significant difference method.

