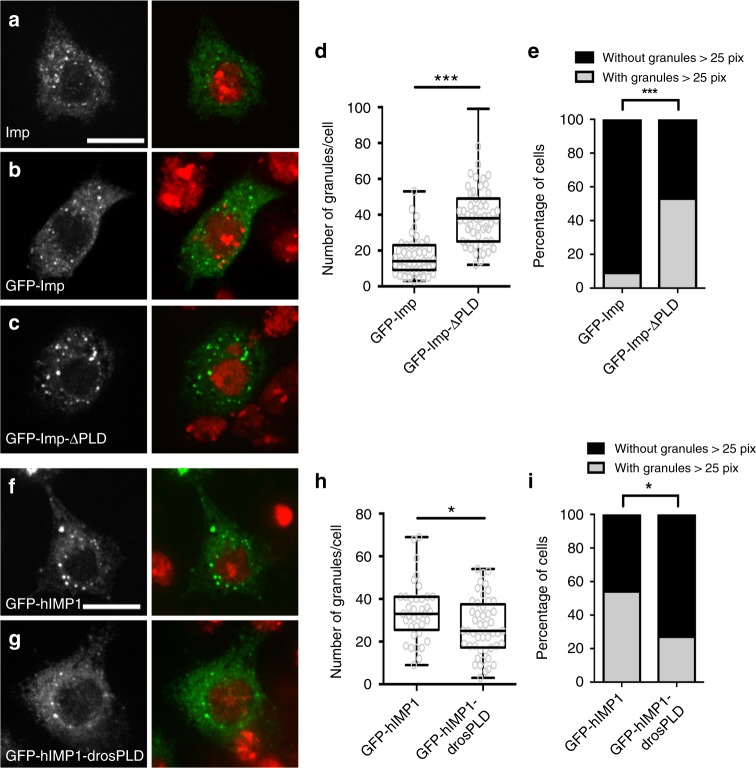
Fig. 7.
Imp PLD modulates granule size and number. a S2R+ cell stained with anti-Imp antibodies (left, green in the overlay), and DAPI (red in the overlay). b, c S2R+ cells transfected with GFP-Imp (b), or GFP-Imp-ΔPLD (c) constructs, and stained with DAPI (red in the overlay). GFP signals are shown in white (left) and green in the overlay (right). Scale bar in a–c: 10 μm. d Distribution of cells in function of their number of GFP-Imp (left) or GFP- Imp-ΔPLD (right) granules. ***P < 0.001 (Mann–Whitney test). e Percentage of cells exhibiting granules larger than 25 pixels. ***P < 0.001 (Fisher’s exact test). 47 and 55 cells were analyzed for GFP-Imp and GFP-Imp-ΔPLD constructs respectively. f, g S2R+ cells transfected with GFP-hIMP1 (f) or GFP-hIMP1-drosPLD (g) constructs, and stained with DAPI (red in the overlay). GFP signals are shown in white (left) and green in the overlay. Scale bar: 10 μm. h Distribution of cells in function of their number of granules. *P < 0.05 (Mann–Whitney test). i Percentage of cells exhibiting granules larger than 25 pixels. *P < 0.05 (Fisher’s exact test). 37 and 49 cells were analyzed for GFP-hIMP1 and GFP-hIMP1-drosPLD, respectively. All box plots are represented using the min to max convention, where the middle line defines the median and the whiskers go down to the smallest value and up to the largest. Source data are provided as a Source Data file

