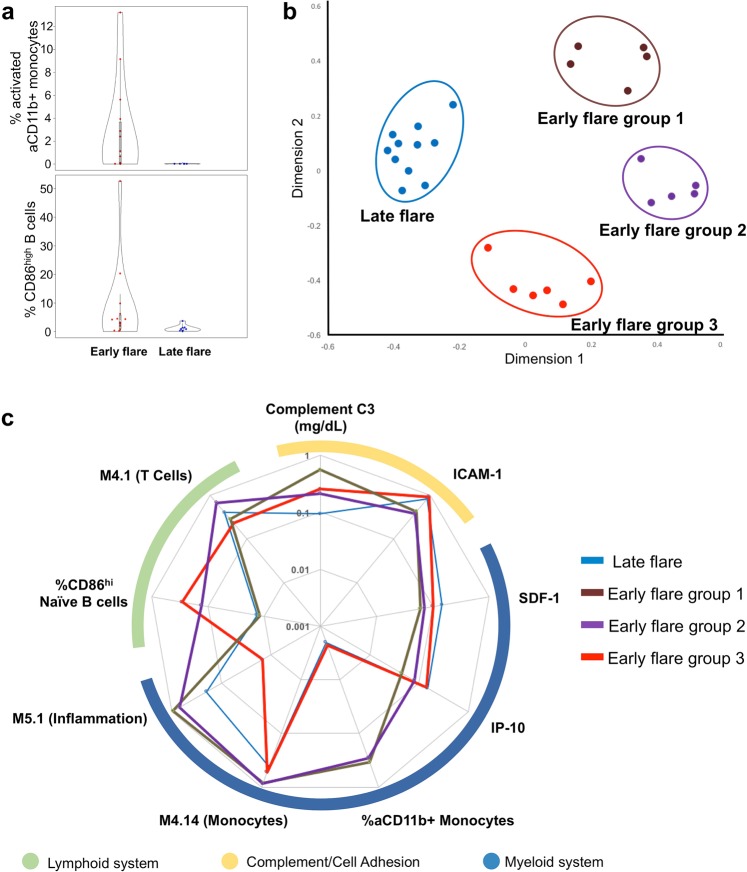
Figure 2.
Transcriptional modules at baseline in SLE patients with early or late flare. (a,b) Activation of transcriptional modules was determined at baseline and compared between SLE patients with early flare (a; n = 21) or late flare (b; n = 13) versus healthy controls. Each box marked with a colored square represents a module, and the color of the square indicates the primary function of the module, as shown at the bottom of the figure. The size of each circle represents the absolute value of the module score. The color represents an increase (red circles; positive scores) or decrease (blue circles; negative scores) in the pathway, in patients compared to controls, as shown at right. P values were determined by non-parametric test. (c) The radar plot summarizes differences between the module scores in the early vs. late flare groups.

