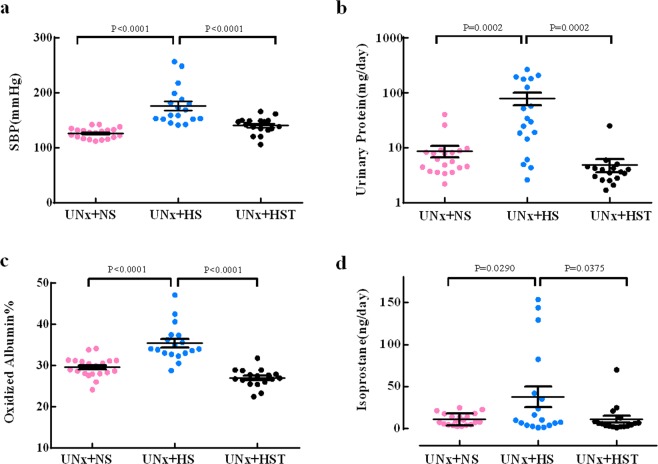
Figure 3.
Validation study of oxidized albumin using a rat model of proteinuria and hypertension. (a) The systolic blood pressure of the UNx + NS group (n = 20), UNx + HS group (n = 18), and UNx + HST (n = 17) for 4 weeks. The values are shown as the AVE ± SEM. (b) The urinary protein level of the proteinuria and hypertension model. The UNx + NS group (n = 20), UNx + HS group (n = 18), and UNx + HST group (n = 17) were evaluated. The values are shown as the AVE ± SEM. (All urinary protein levels were logarithmically transformed prior to statistical analysis by ANOVA with Tukey’s post hoc test because they had a heteroscedastic distribution). (c) Oxidized albumin% of the proteinuria and hypertension model. The UNx + NS group (n = 20), UNx + HS group (n = 18), and UNx + HST group (n = 17) were evaluated. The values are shown as the AVE ± SEM. (d) The 8-isoprostane level of the proteinuria and hypertension model. The UNx + NS group (n = 20), UNx + HS group (n = 18), and UNx + HST group (n = 17) were evaluated. The values are shown as AVE ± SEM.

