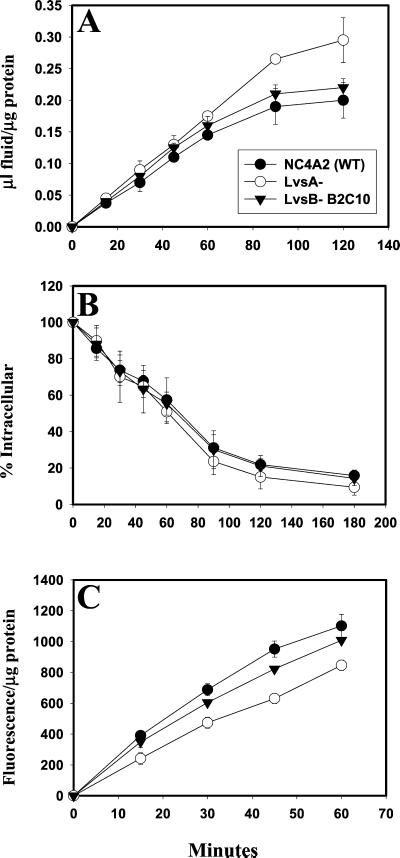
Figure 7.
The rates of endocytosis, phagocytosis, and fluid exocytosis are comparable between lvsB-null and control cells; lvsA-null cells are defective in phagocytosis. Endocytosis rates (A), exocytosis rates (B), and phagocytosis rates (C) were measured for control cells and the lvsA-null and lvsB-null mutants as described in MATERIALS AND METHODS. lvsA-null cells were significantly reduced in the rate of phagocytosis (unpaired, two-tailed Student's t test, p < 0.01) compared with control cells, whereas, lvsB-null and control cells were not significantly different.

