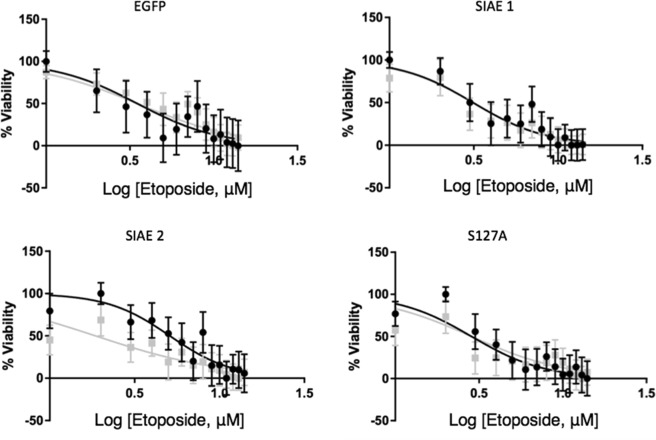
Figure 7.
Response to etoposide is altered in SIAE over-expressing cells. RES256 cells were exposed to etoposide for 72 hours after 48 hours of induction with SIAE. No significant differences in response to drug were seen with induction of expression (induced expression is shown in grey) in EGFP, SIAE 1 or S127A (p > 0.05), however the IC50 was significantly reduced from 5.1 μM (±1.3) to 1.9 μM (±0.9) in SIAE 2 (p = 0.0034). Data analysed using GraphPad Prism 6 software using sigmoidal dose-response comparison analysis. Data presented as mean ± SEM n = 3.

