Fig. 4.
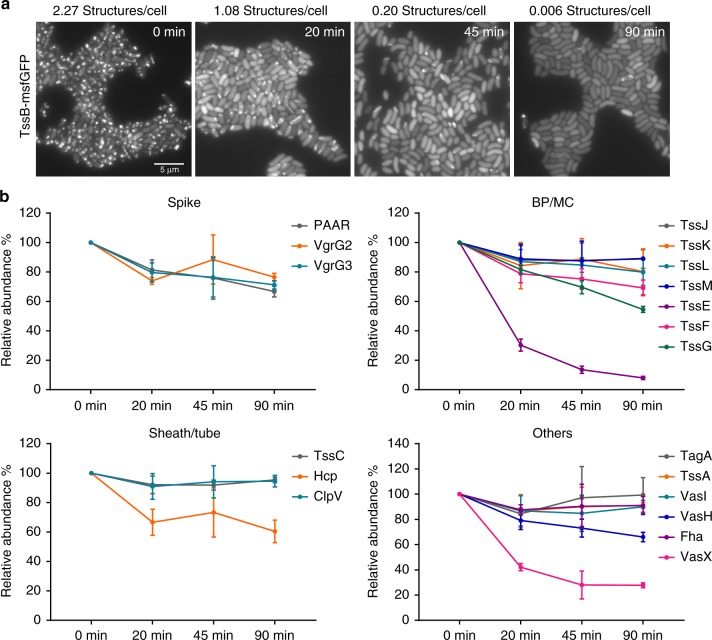
Change in abundance of V. cholerae T6SS proteins upon chloramphenicol treatment. a The sheath assembly was monitored by TssB-msfGFP localization after 1 mg/ml of CAM treatment. Representative images of GFP channel are shown. Time-lapse movies with a larger field of view can be found in Supplementary Movie 2. The average number of sheaths is indicated above the images. Scale bar: 5 µm. b The relative abundance levels of each component at four time points following the CAM treatment (0, 20, 45, and 90 min, respectively). Note the y‐axis is shown as % abundance normalized to TssB related to the protein levels at T0 (0 min; pre-treatment). The error bar represents the standard deviation of measurements (n = 3 biologically independent samples). Plots were grouped into four subsets: spike proteins, baseplate/membrane complex, sheath/tube proteins, and other components. Individual plots are shown in Supplementary Fig. 3. The detailed quantification for this figure can be found in Supplementary Data 3. Source data are provided as a Source Data file

