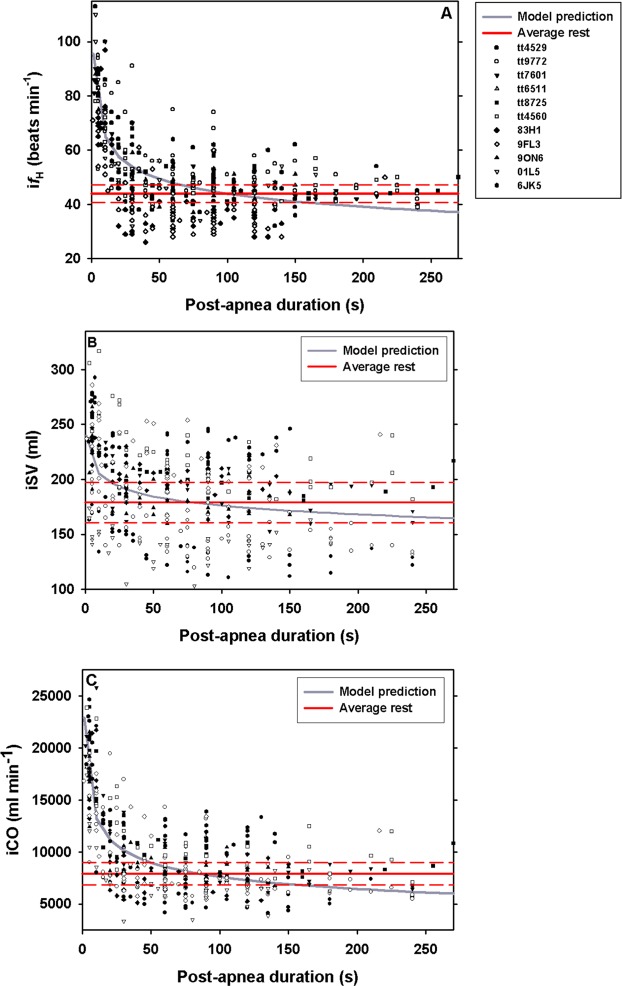
Figure 2.
Instantaneous (A) heart rate (ifH, n = 13), (B) stroke volume (iSV, n = 11), and (C) cardiac output (iCO, n = 11) versus duration following a voluntary surface apnea (s) at rest in bottlenose dolphin. Solid and dotted red lines are the resting average and 95% confidence limits, respectively while breathing after correcting for respiratory sinus arrhythmia. Gray solid line is model predicted regressions. The legend in panel A give the symbol for each individual animal in panels A–C.

