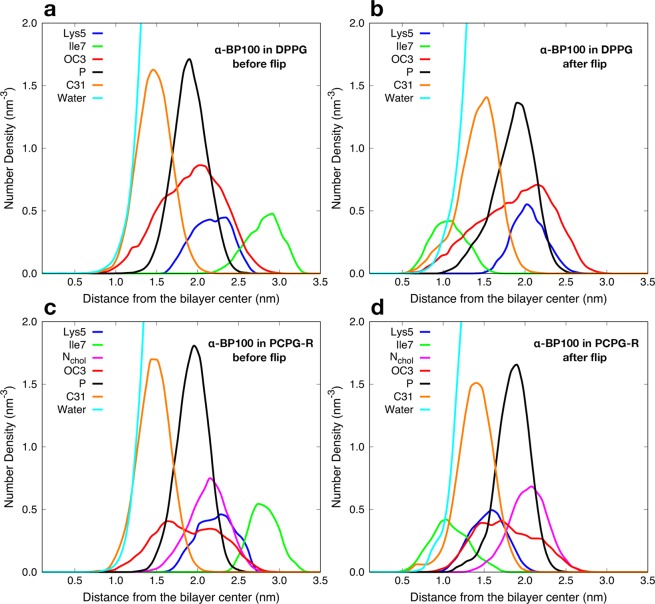
Figure 9.
Peptide flip observed through number density analysis. (a and b) show respectively before and after the flip in α-BP100 in DPPG simulation; c) and d) demonstrate the flip for α-BP100 in PCPG-R simulation. Lys5 represents the polar side of BP100 and Ile7, the apolar facet (Fig. 2c). OC3 (DPPG head group further out glycerol Oxygen), Nchol (DPPC head group choline Nitrogen), P (Phosphorus) and C31 (first carbon from sn-1 acyl chain) are shown to display BP100 insertion into the bilayer after the flip.

