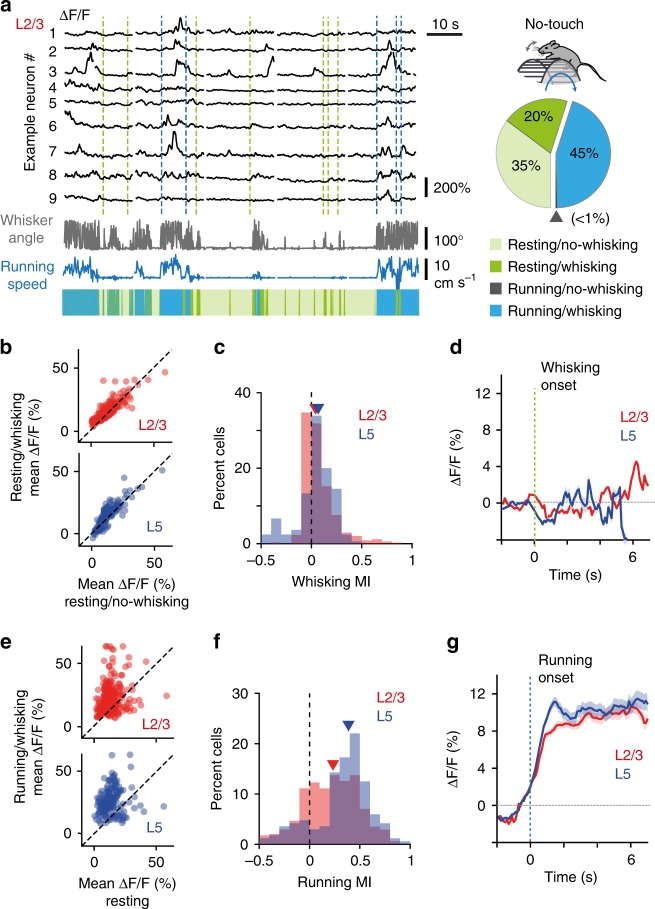
Fig. 2.
Running with concomitant whisking increases L2/3 and L5 activity more than whisking alone. a Left: Example ΔF/F traces along with whisker angle and running speed in the initial No-touch trials of Fig. 1d. The four possible running and whisking state conditions are color-coded. Green and blue vertical dotted lines mark whisking onset (only during resting periods) and running onset, respectively. Right: Pie chart of the distribution of times spent in the four states for five mice (in the ‘No-touch’ condition). Gray triangle indicates <1% fraction of time spent in the running/no-whisking state. b Scatter plots of mean ΔF/F amplitude in resting/whisking periods versus resting/no-whisking periods for 342 L2/3 neurons (red) and 168 L5 neurons (blue). Dashed lines indicate unity lines. c Distribution of whisking modulation index (MI) for L2/3 and L5 neurons. Red and blue triangles indicate medians. d Population average of whisking-onset-aligned ΔF/F traces for all recorded neurons. e Scatter plots of mean ΔF/F amplitude in running/whisking periods versus resting periods for L2/3 (top) and L5 (bottom) neurons. f, g Analog plots to (c), (d) for running modulation index (MI) and running-onset-aligned ΔF/F traces

