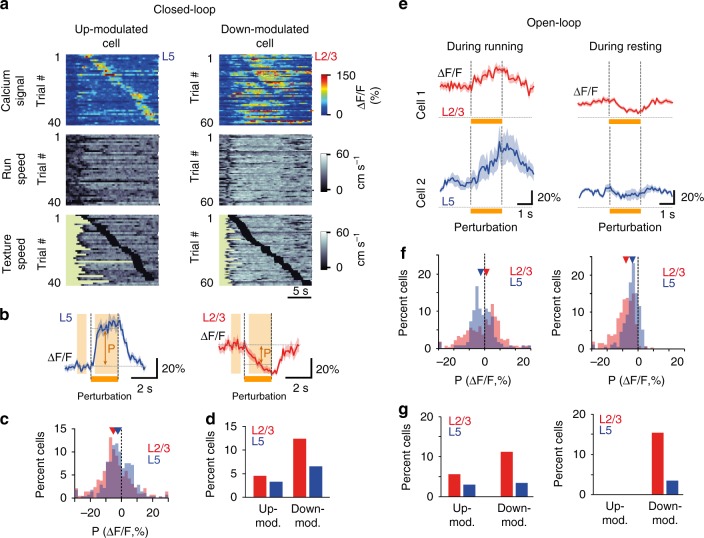
Fig. 5.
A subset of neurons responds to perturbations of tactile flow. a Calcium signals for two example neurons across multiple Closed-loop trials. Trials are sorted according to when the perturbation (2-s texture halt) occurred. Running speed and texture speed are plotted below with black periods marking stop of texture rotation. The left L5 neuron is an example of an up-modulated cell whereas the right L2/3 neuron exemplifies down-modulation upon perturbation. b Mean ΔF/F traces (±s.e.m.) aligned to perturbation onset for the example neurons in (a). ‘P’ indicates the amplitude of perturbation-induced modulation defined as the difference between mean ΔF/F values before (−1 to −0.3 s window) and during perturbation (+0.3 to 2 s, orange shaded areas). c Distribution of perturbation-induced modulation for all L2/3 (red, n = 420) and L5 (blue, n = 275) neurons. Triangles mark medians of −5.1% and −2.3% for L2/3 and L5 neurons, respectively. d Percentage of significantly up-modulated (P > 2σ) and down-modulated (P < −2σ) neurons in L2/3 and L5 populations, respectively, with σ denoting baseline noise (see Methods). e Perturbation responses of two example neurons in Open-loop condition, where sudden stalling of the texture rotation may occur during running (left panels) or resting (right panels). f Distribution of perturbation modulation (P) for neurons in L2/3 (red, n = 269) and L5 (blue, n = 234) neurons during running (left panel, mean P: −0.7 ± 0.7% and −1.7 ± 0.6% for L2/3 and L5; p < 0.05) and during resting (right panel, 253 L2/3 neurons, red, and 172 L5 neurons, blue; mean P: −9.2 ± 0.5% and −4.3 ± 0.4% for L2/3 and L5, respectively, p < 0.0001). Wilcoxon rank sum test was used for distribution comparisons. g Percentage of neurons that are significantly up-modulated (P > 2σ) and down-modulated (P < −2σ) for L2/3 (red) and L5 (blue) populations during running (left) and during resting state (right)

