Fig. 6.
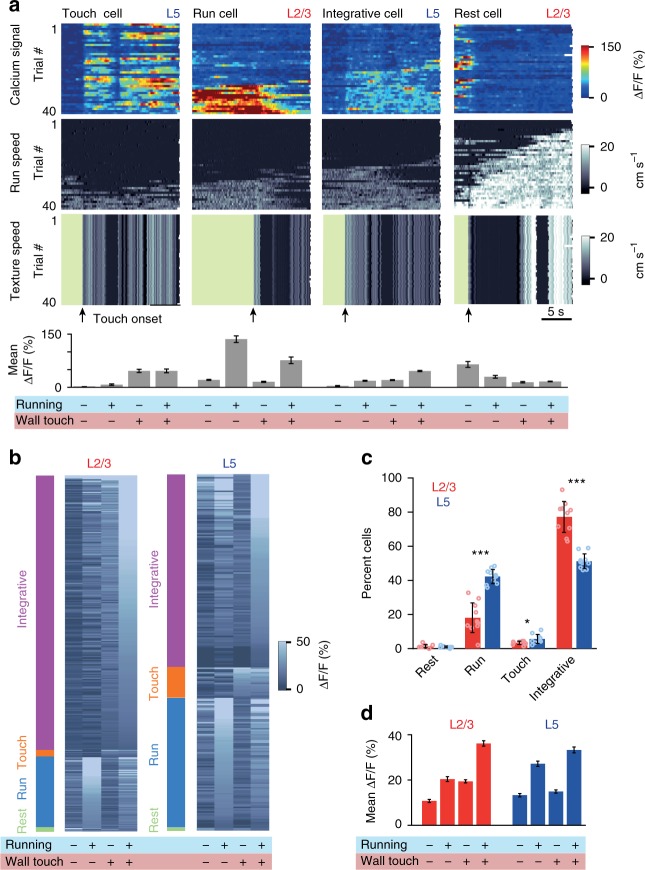
A higher fraction of neurons integrate locomotion and concurrent wall touch in L2/3 compared with L5. a Four example neurons with different response properties recorded during Open-loop stimulation. Each column presents data from a single neuron across trials in a single session. Top panel heat map shows ΔF/F calcium signal with each row representing a trial. Trials are sorted according to the mean run speed of a trial. Middle and bottom panels show the run speed and texture-rotation speed of corresponding trials. Green periods in the bottom panel indicate when the texture was not in contact with whiskers. Bar graphs at the bottom are mean ΔF/F activity during the four stimulus and movement conditions: no-touch/no-running, running/no-touch, touch/no-running, and touch/running. b Categorization of all L2/3 (n = 338, 5 mice) and L5 (n = 236, 4 mice) neurons according to their activity during their first Open-loop session. Color bars on the left show categories, gray scale shading shows mean ΔF/F at four stimulus/behavior conditions. Cells are sorted according to their mean activity during ‘running/wall touch’ condition relevant to their assigned category. c Normalized distributions of four response categories in L2/3 and L5 populations. Means and standard deviations are calculated from 10 random selections of 11 sessions out of total 24 recording sessions. (Two-sampled T-test is performed to compare distributions for each category prest = 0.2, prun = 5.7 × 10⁻⁷, ptouch = 0.02, pintegrative = 3.7 × 10⁻⁷.) d Average population responses for the four stimulus/movement conditions for L2/3 (in red) and L5 (in blue) neurons shown in (b) (mean ΔF/F ± s.e.m.)

