Fig. 2.
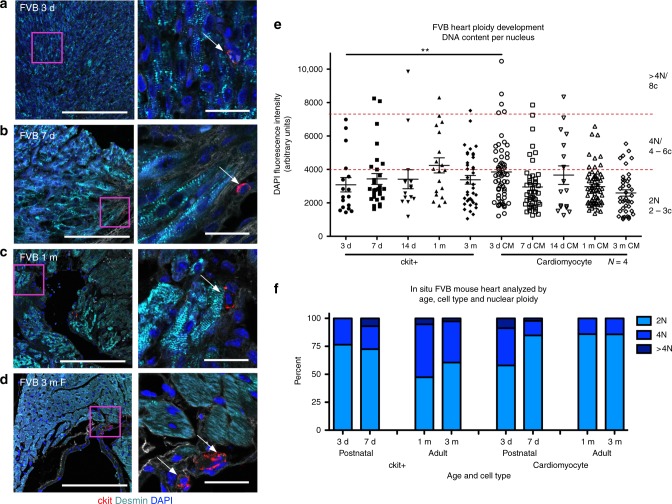
Ploidy variability in murine cardiomyocytes and c-kit+ CICs. FVB mouse myocardial tissue sections assessed by in situ quantitation of ploidy level post birth at 3 days (a), 7 days (b), 30 days (c), and 90 days (d) (zoomed-out scalebar = 150 μm; zoomed-in scalebar = 25 μm). Boxed regions of higher magnification are shown to the right of each scan. Arrows point to example cCICs included in the analysis. Compiled quantification of in situ DNA content per nucleus of cardiomyocytes and ckit+ cells measured by DAPI fluorescent intensity of the nucleus within 3D reconstruction of tissue (e). Percent of cCICs and cardiomyocytes nuclei with diploid tetraploid and higher ploidy content (f). **P < 0.01. Data are presented as mean ± SEM and analyzed using a t test, at each time point, or one-way ANOVA with Bonferroni post hoc test within cell types (e)

