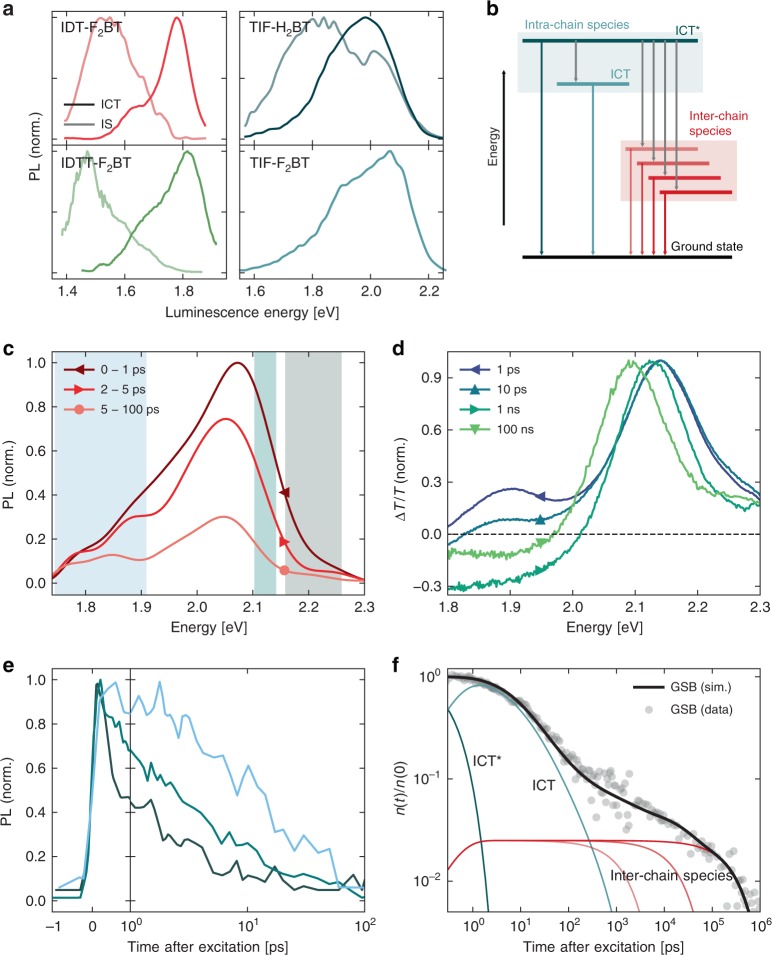
Fig. 3.
Transient optical characterisation. a PL spectra of the prompt and delayed emissive species extracted from the genetic algorithm. b Energy level diagram summarising the exciton dynamics. For TIF-H2BT: (c) ultrafast PL spectra normalised to the maximum of the first time-slice shown; (d) normalised TA spectra for different time delays; (e) kinetics of the PL decay in the different energy bands shaded in (a); and (f) GSB with population fits normalised to the maximum signal together with a fit of the contributions from different excited state species according to the kinetic model

