Fig. 5.

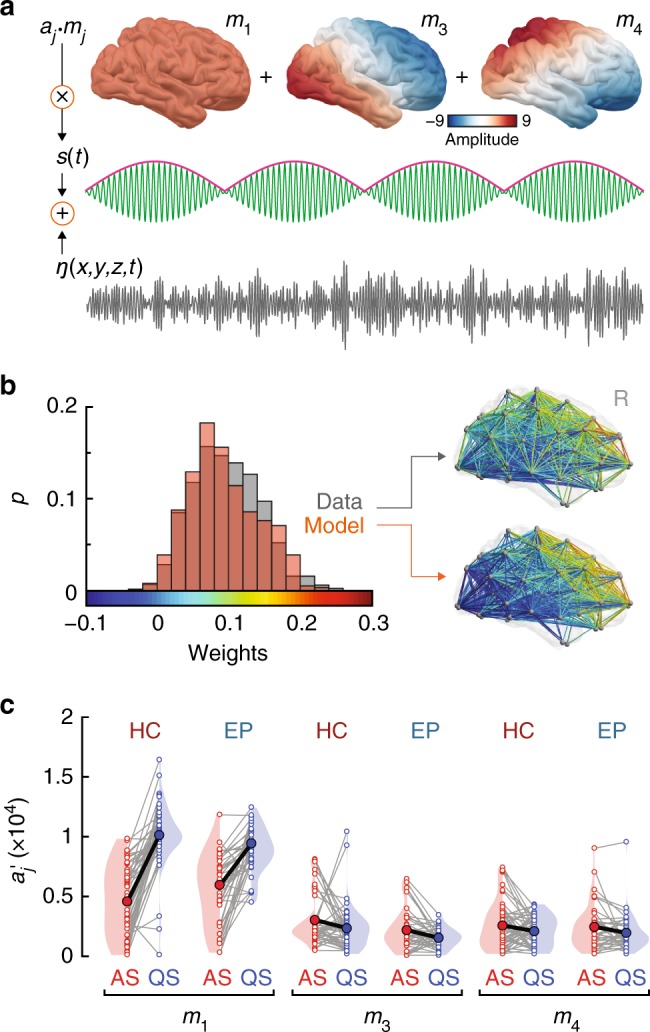
Analysis of low-dimensional modes of spatiotemporal neural activity as a function of sleep states. a Schematic representation of the neural field model adopted to investigate the principles underpinning patterns of functional connectivity associated with neonatal sleep states. The model is composed of cortical eigenmodes11, a low-frequency signal amplitude modulation (pink), a faster carrier frequency (green), and spatiotemporal Gaussian white noise. The first six modes are depicted in Supplementary Fig. 4. b Comparison between empirical data (control infant in AS) and fitted model functional connectivity. The histograms show the probability distributions of connectivity weights of all network edges in the data (gray) and model (orange). The best fit minimizes the sum of the squared differences between the modeled and empirical distribution means and SDs (Methods). The brains depict the spatial distributions of the connectivity weights for the data and model fit. Supplementary Fig. 5 provides a broader overview of the fitting between model and real data across representative subjects. c Mode (mj) weights () calculated across the three modes as a function of sleep states and group. Gray lines link individual subject weights (open circles), thick black lines link state-specific group mean weights (filled circles). Significant main effects of sleep are observed for the three modes of interest (mixed ANOVA: mode 1: p = 8.2 × 10⁻²², mode 3: p = 0.006, mode 4: p = 0.021). A sleep-by-group interaction is present in mode 1 (p = 0.006). Source data are provided as a Source Data file
