. 2016 Oct 22;33(4):267–276. doi: 10.5511/plantbiotechnology.16.0216a

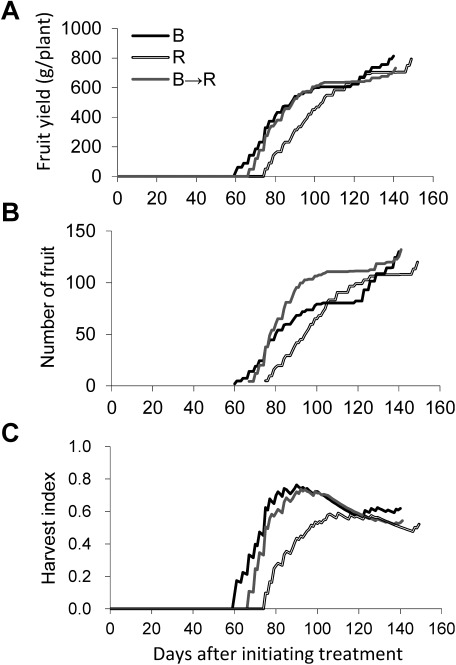
Figure 9. Fruit yield (A), number of fruit (B) and harvest index (C) of everbearing strawberry plants ‘HS138.’ The harvest index was estimated by dividing fruit dry weight by estimated dry matter at each day. Estimated dry matter at each day was calculated by assuming that dry matter increased linearly at the rate of dry matter increment per day (Table 3). Blue (B) and Red (R): under continuous lighting illuminated by blue LEDs and red LEDs, respectively, B→R: under continuous lighting illuminated by blue LEDs substituted with red LEDs at 20 days after initiating treatment. The numbers of days to anthesis of B, R, and B→R were 40, 49, and 41, respectively. After 10 days after anthesis, the plants were grown under continuous lighting illuminated by white fluorescent lamps (PPF: 225 µmol m−2 s−1).

Figure 9. Fruit yield (A), number of fruit (B) and harvest index (C) of everbearing strawberry plants ‘HS138.’ The harvest index was estimated by dividing fruit dry weight by estimated dry matter at each day. Estimated dry matter at each day was calculated by assuming that dry matter increased linearly at the rate of dry matter increment per day (Table 3). Blue (B) and Red (R): under continuous lighting illuminated by blue LEDs and red LEDs, respectively, B→R: under continuous lighting illuminated by blue LEDs substituted with red LEDs at 20 days after initiating treatment. The numbers of days to anthesis of B, R, and B→R were 40, 49, and 41, respectively. After 10 days after anthesis, the plants were grown under continuous lighting illuminated by white fluorescent lamps (PPF: 225 µmol m−2 s−1).