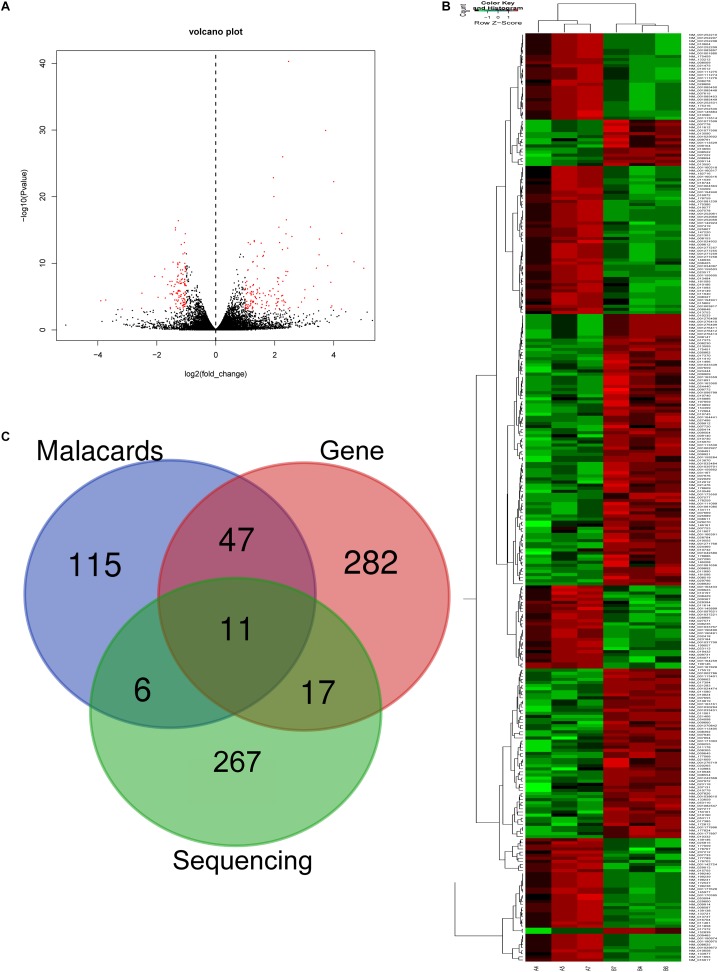
FIGURE 3.
Volcano plots and heat map of mRNA expression between asthma and control groups. (A) Volcano plot assessment of gene expression in CD4+ T cells between asthma and control groups. Red dots represent different mRNAs (p < 0.05) showing fold changes >=2 or <= -2. (B) Heat map analysis of differentially expressed mRNAs between the asthma and control groups. Green indicates low expression, and red indicates high expression. A4, A5, and A7 were the control groups; B4, B6, and B7 were CD4+ T cells from the asthma group. (C) The Venn diagram of genes about asthma from sequencing compared with gene database and malacards database.

