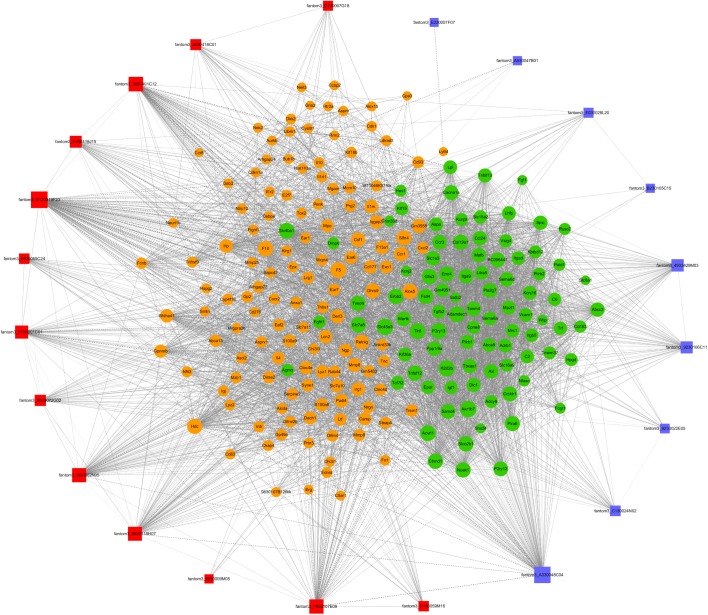
FIGURE 4.
LncRNA–mRNA co-expression networks. Twenty-three lncRNAs and 301 mRNAs were included in the co-expression network | COR| >0.95; p < 0.05). The red boxes indicate upregulated lncRNAs, and the blue boxes indicate downregulated lncRNAs. The green nodes indicate downregulated mRNAs, and the yellow nodes indicate upregulated mRNA. The value of “degree” indicates the size of the boxes or nodes. The width of the lines denotes the Pearson correlation coefficient, where the full line indicates a positive correlation and the imaginary line indicates a negative correlation.

