letter
. 2017 Sep 16;34(3):151–158. doi: 10.5511/plantbiotechnology.17.0727a

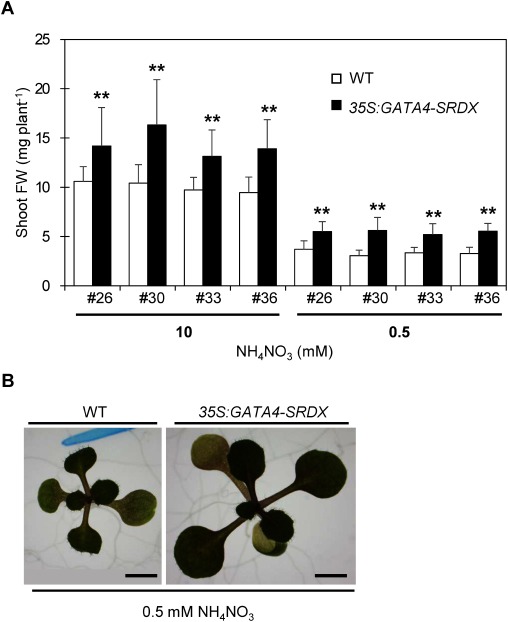
Figure 1. Phenotype at 14 days after sowing (DAS) of 35S:GATA4-SRDX and wild type seedlings. (A) Comparison of shoot fresh weight (FW) between wild type (WT) and 35S:GATA4-SRDX plants under nitrogen-sufficient (10 mM NH4NO3) and nitrogen-deficient (0.5 mM NH4NO3). Open and closed bars indicate wild type and 35S:GATA4-SRDX plants, respectively. An Arabic numeral with ‘#’ symbol under each closed bar represents an independent line of 35S:GATA4-SRDX plants. Values are means±SD (n=16–23). Double asterisks indicate significant differences at p<0.01 in t-test when compared to wild type grown in each nitrogen condition. (B) Photos of 14 DAS wild type and independent line #30 of 35S:GATA4-SRDX plants grown under nitrogen-deficient conditions. Scale bar; 2 mm.

Figure 1. Phenotype at 14 days after sowing (DAS) of 35S:GATA4-SRDX and wild type seedlings. (A) Comparison of shoot fresh weight (FW) between wild type (WT) and 35S:GATA4-SRDX plants under nitrogen-sufficient (10 mM NH4NO3) and nitrogen-deficient (0.5 mM NH4NO3). Open and closed bars indicate wild type and 35S:GATA4-SRDX plants, respectively. An Arabic numeral with ‘#’ symbol under each closed bar represents an independent line of 35S:GATA4-SRDX plants. Values are means±SD (n=16–23). Double asterisks indicate significant differences at p<0.01 in t-test when compared to wild type grown in each nitrogen condition. (B) Photos of 14 DAS wild type and independent line #30 of 35S:GATA4-SRDX plants grown under nitrogen-deficient conditions. Scale bar; 2 mm.