letter
. 2017 Sep 16;34(3):151–158. doi: 10.5511/plantbiotechnology.17.0727a

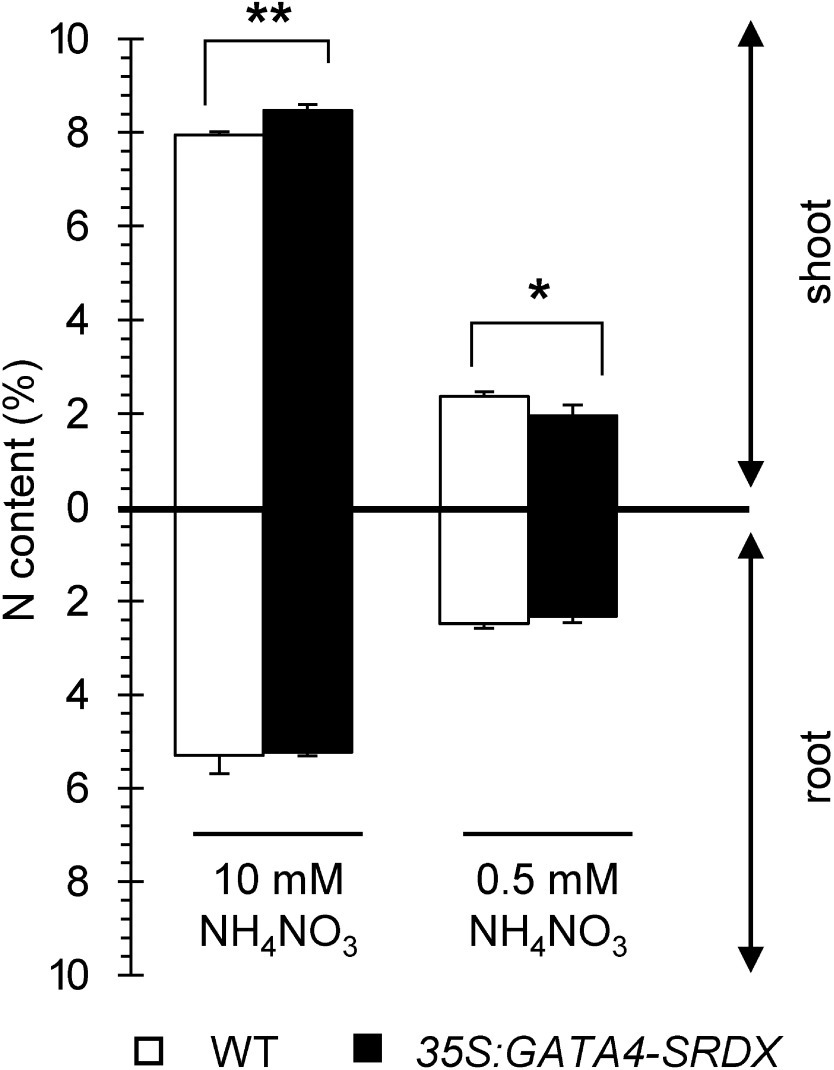
Figure 4. Nitrogen content in shoots and roots of wild type and 35S:GATA4-SRDX plants. Plants were grown under different nitrogen conditions for 15 DAS. Values are means±SD of four independent biological replicates. Single and double asterisks indicate significant difference at p<0.05 and 0.01, respectively, in t-test when compared to wild type grown in each nitrogen condition.

Figure 4. Nitrogen content in shoots and roots of wild type and 35S:GATA4-SRDX plants. Plants were grown under different nitrogen conditions for 15 DAS. Values are means±SD of four independent biological replicates. Single and double asterisks indicate significant difference at p<0.05 and 0.01, respectively, in t-test when compared to wild type grown in each nitrogen condition.