letter
. 2017 Sep 16;34(3):151–158. doi: 10.5511/plantbiotechnology.17.0727a

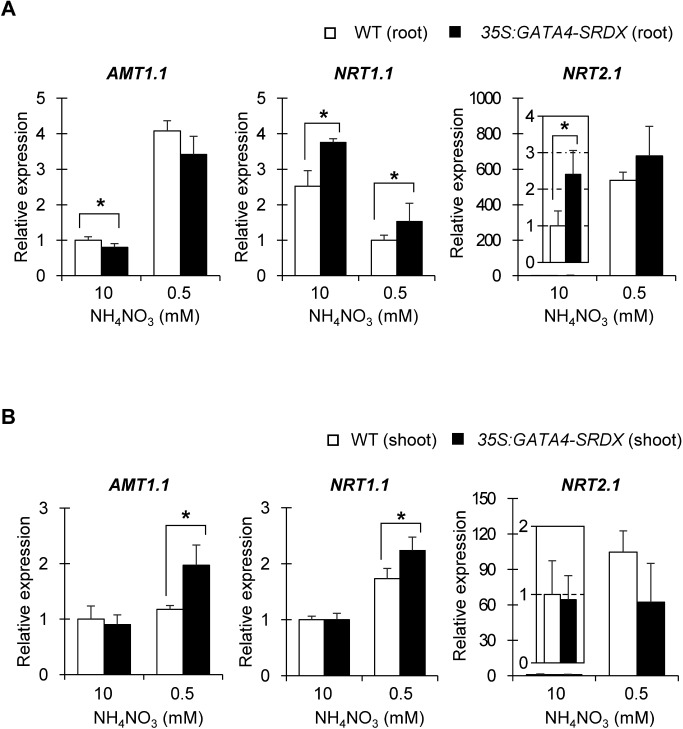
Figure 5. Expression of nitrogen transporter genes. Gene expression in roots (A) and shoots (B) of 13 DAS plants grown under different nitrogen conditions, measured by qRT-PCR, and all expression levels were normalized to that of PP2AA3 (At1g3320), reference gene. Values are means±SD of four independent biological replicates. Single and double asterisks indicate significant differences at p< 0.05 and 0.01, respectively, in t-test when compared to wild type grown in each nitrogen condition.

Figure 5. Expression of nitrogen transporter genes. Gene expression in roots (A) and shoots (B) of 13 DAS plants grown under different nitrogen conditions, measured by qRT-PCR, and all expression levels were normalized to that of PP2AA3 (At1g3320), reference gene. Values are means±SD of four independent biological replicates. Single and double asterisks indicate significant differences at p< 0.05 and 0.01, respectively, in t-test when compared to wild type grown in each nitrogen condition.