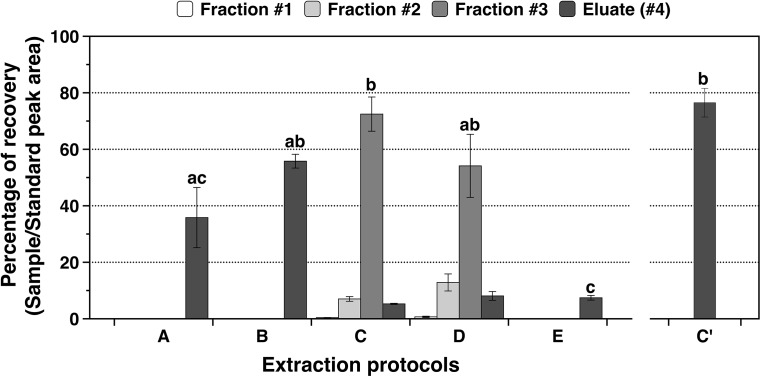
FIGURE 4.
Recovery percentages for all the fractions (#1, #2, and #3) and eluates (#4) of the five extractions protocols (A, B, C, D, and E) and new method (C’) on NRVC980385 leaves. Methods detail for A to E can be seen on Figure 1. Columns correspond to mean ± SEM of 4 replicates for methods A to E whereas mean ± SEM of 6 replicates for method C’, letters above bars indicate significant differences between varieties for each tissue analyzed (Tukey tests at p < 0.05).

