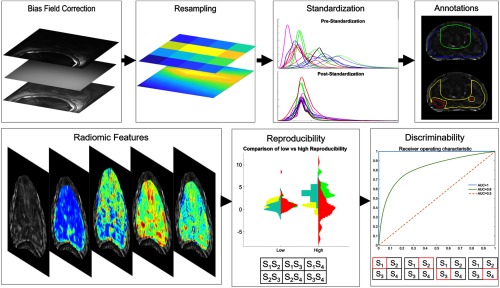
Fig. 1.
Overview of the experimental workflow. The upper row shows the preprocessing steps applied to each MRI dataset. The lower row shows experimental benchmarking of radiomic features in terms of multisite reproducibility and discriminability. The table under reproducibility shows all the cross-site pairings used to calculate the two different reproducibility measures. The tables under discriminability show four training and testing set used to calculate the cross-site discriminability measure, with the red box corresponding to the held-out testing site in each run.

