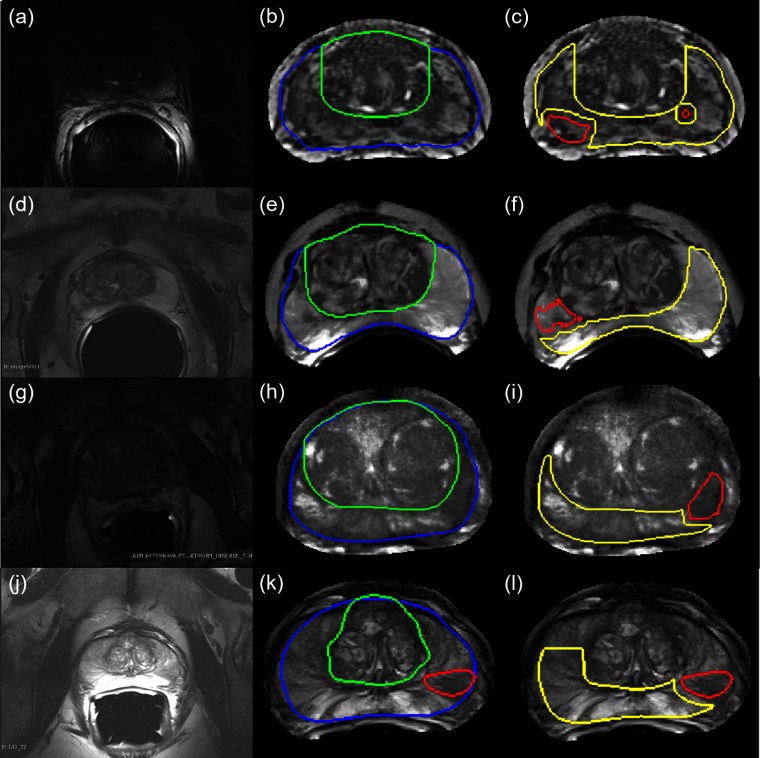
Fig. 2.
Results of annotating and correcting representative T2w MRI datasets, each row corresponding to a different site. (a), (d), (g), and (j) Original field-of-view prostate T2w MRIs. (b), (e), (h), and (k) Same 2-D MRIs after bias field correction, resampling, and intensity standardization, but cropped to around the prostate capsule alone. Note the relatively uniform appearance of the image. Also shown are the expert annotations for the prostate capsule (in blue) and the central gland (in green). (c), (f), (i), and (l) Expert-annotated tumor region in red and the “nontumor” region in yellow are shown for each of these images.

