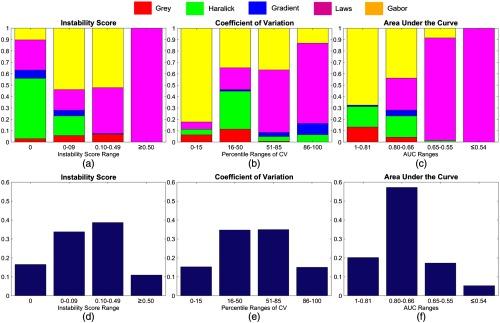
Fig. 3.
Cumulative bar plots depicting the proportion of radiomic features that lie within specified bins for (a) and (d) , (b) and (e) , and (c) and (f) AUC. Bins in each plot are chosen to roughly correspond to 0 to 15th percentile, 16 to 50th percentiles, 51 to 85th percentiles, and 86 to 100th percentiles of performance for each measure. Note that the -axis of CV (b) comprises percentiles as this measure is not bounded, unlike IS (a) and AUC (c), which are bounded and thus comprise the original values. The top row of bar plots (a)–(c) shows the proportion of each radiomic feature family (in different colors) that lies within each bin. The bottom row of bar plots (d)–(f) shows the percentage of the total number of features found within each bin.

