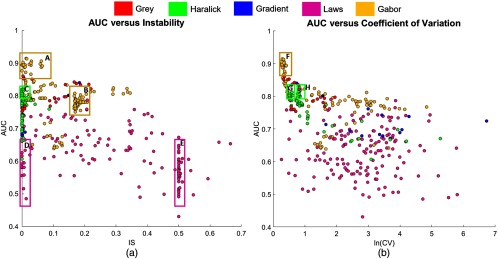
Fig. 5.
The 2-D scatter plots illustrating the relationship between measures: (a) versus AUC and (b) versus AUC. Each point in the scatter plot represents an individual feature, and each color represents the feature family. The boxes identify specific feature clusters of interest, which are further discussed in Sec. 4.2.

