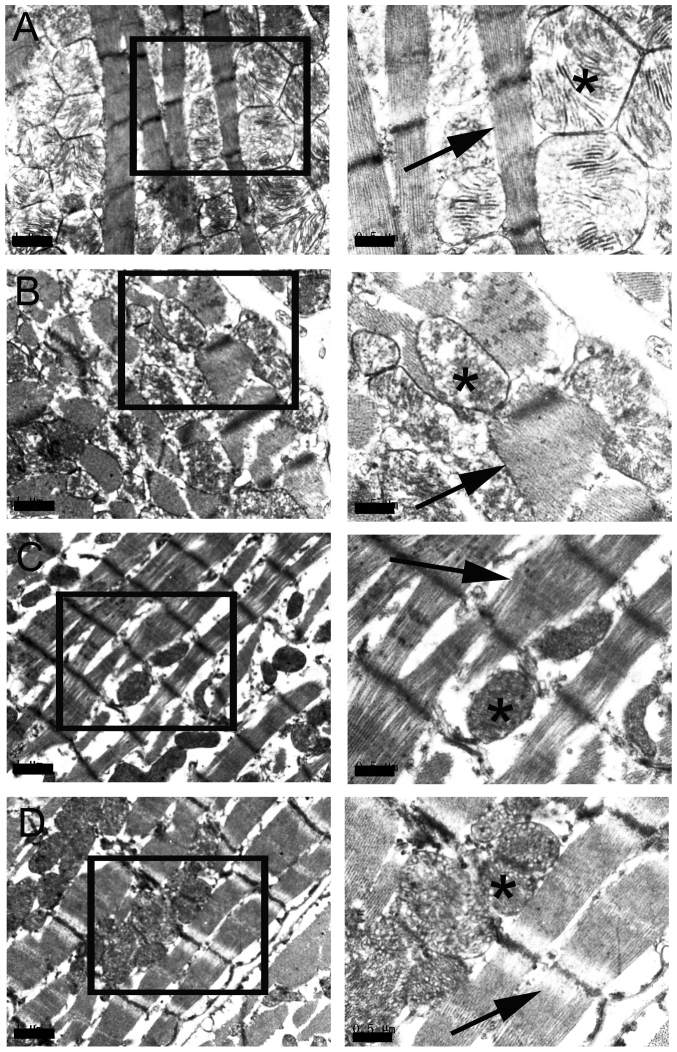
Figure 1.
Transmission electron microscopy images depicting the morphology cardiomyocyte myofibrils and mitochondria. The inset in each picture is enlarged and displayed on the right. (A) Normal structure of mitochondrial and myofibrils were observed in the control group; mitochondrial cristae were clearly observed (indicated by the asterisk) and myofibrils were intact and in parallel rows (indicated by the arrow). (B) In the diabetes group, mitochondrial cristae of myocardial cells disappeared and there were vacuoles in the swollen mitochondrial matrix (indicated by asterisk). The myofibrils were disordered (indicated by arrow). TSIIA prevented the appearance of distorted myofibrils (indicated by the arrow) and swollen mitochondria (indicated by the asterisk) in the (C) L-TSIIA and (D) H-TSIIA groups. Scale bar: 1 µm in left column; 0.5 µm in right column. TSIIA, Tanshinone IIA; L-TSIIA, diabetic rat treated with lower-dose TSIIA (2 mg/kg/day); H-TSIIA, diabetic rat treated with high-dose TSIIA (4 mg/kg/day).

