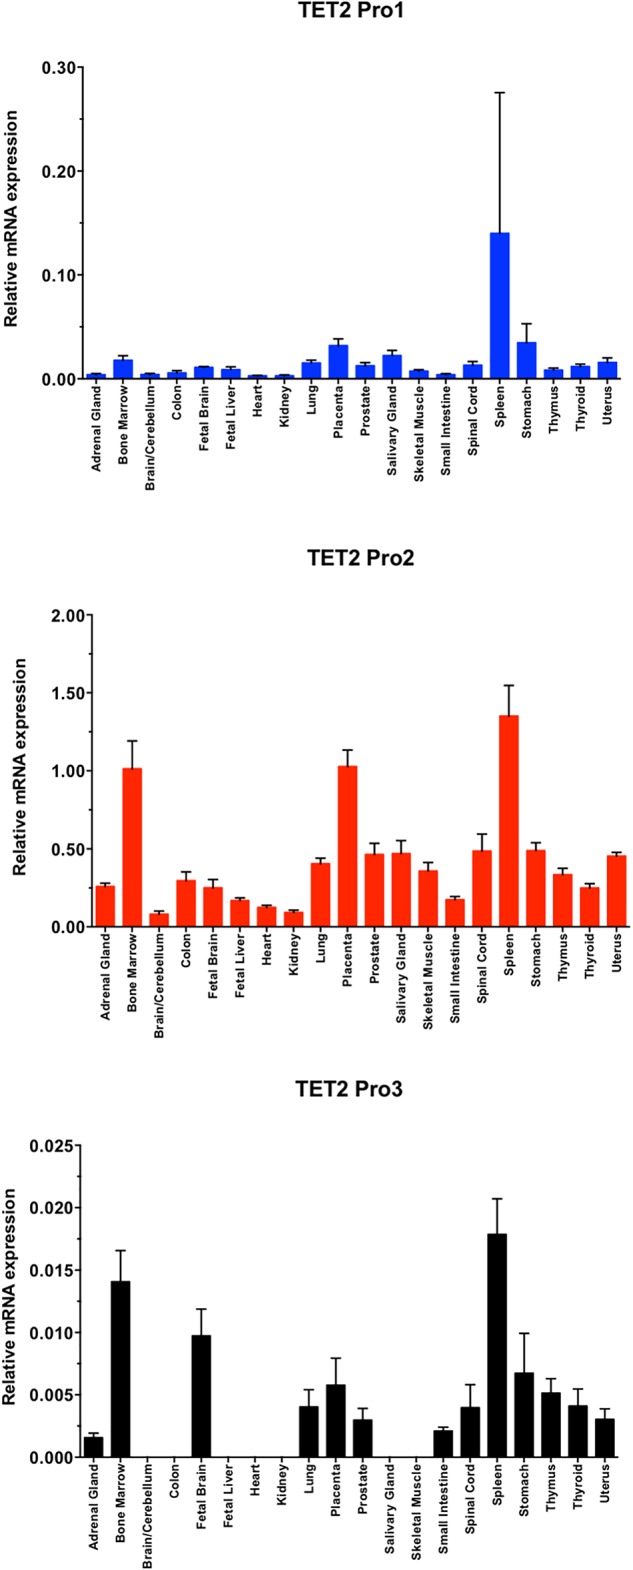
FIGURE 5.

TET2 transcript levels in normal tissues. A total RNA from a human tissue RNA panel was reverse-transcribed, and cDNAs were investigated by qPCR relative quantification analysis with Pro1, Pro2, and Pro3-specific primers. Tissues of origin are listed for each lane. The cDNA levels of TET2 Pro1, Pro2, and Pro3 were normalized to β-actin.
