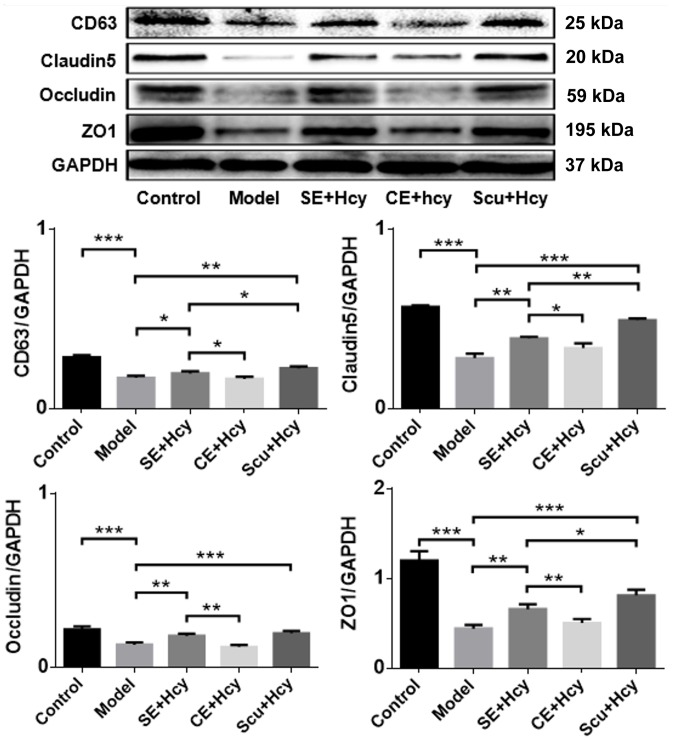
Figure 5.
Representative western blot and quantified results for CD63, claudin-5, occludin and ZO1 expression. *P<0.05, **P<0.01 and ***P<0.001 with a bar linking the groups with an asterisk. n=3. CD, cluster of differentiation; ZO1, tight junction protein 1; Model, 2.5 mmol/l Hcy-induced rat brain microvascular endothelial cells; CE, control-treated exosomes; Scu, Scutellarin; SE, Scu-treated exosomes; Hcy, homocysteine.

