Figure 1.
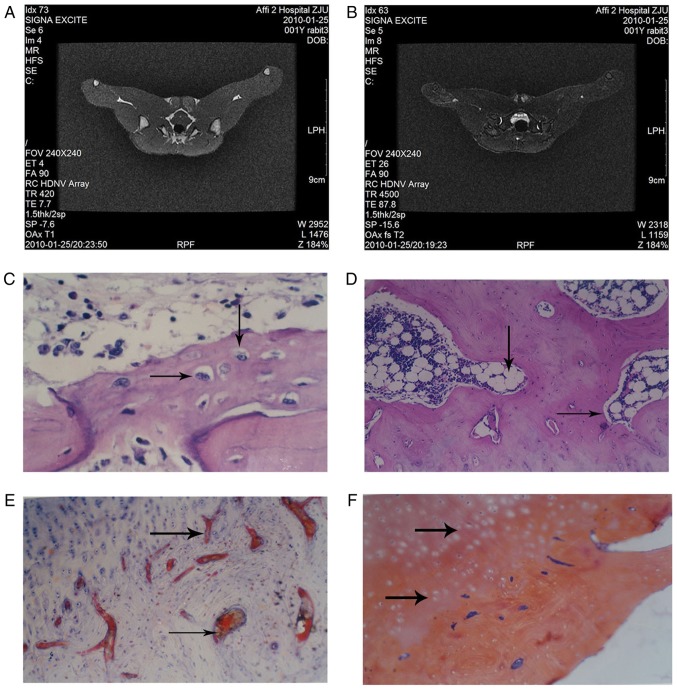
Histopathology of the rabbit tissue in the normal group and the model group. Magnetic resonance imaging scans were performed on rabbits in the (A) normal and (B) model group and representative images are presented. Hematoxylin and eosin staining was performed on tissue from the (C) normal group (arrows indicate osteoblasts) and the (D) model group (arrows indicate empty bone cells). (E) Sudan III staining was performed on tissue from the model group (arrows indicate fat emboli). (F) Phosphotungstic acid hematoxylin staining was performed on tissue from the model group (arrows indicate fibrin emboli). All the images were obtained at a magnification, ×100.

